.jpg)
Do not index
Introduction
In this thread, I will be breaking down each of the setups below and providing my personal entry & exit tactics along with examples.
- High Volume Close
- Inside Day and Up Pattern
- Key Moving Average Pullback
Let's jump into them 💪
1. High Volume Close (HVC)
The HVC setup is my go-to. It's also the most simple! This pattern occurs after a stock gaps up on huge volume due to earnings or another major news event. The most important point for the stock going forwards is the gap up closing price.
Main HVC Characteristics
· Highest Volume Ever (HVE)
· Highest Volume in 1 Year (HVIPO)
· Highest Volume Since IPO Week (HVIPO)
· Higheset Volume Since Last EPS (HVLE)
These characteristics show clear INSTITUTIONAL DEMAND.
A few more traits to screen for:
· 75% (or more) closing range on gap day
· Gap to new highs or within 20% of prior highs
If a stock is showing the above characteristics, and the market is favorable, there is a massive chance you have found a huge winner.
Marked-up examples to study:
$TWLO from 2020:
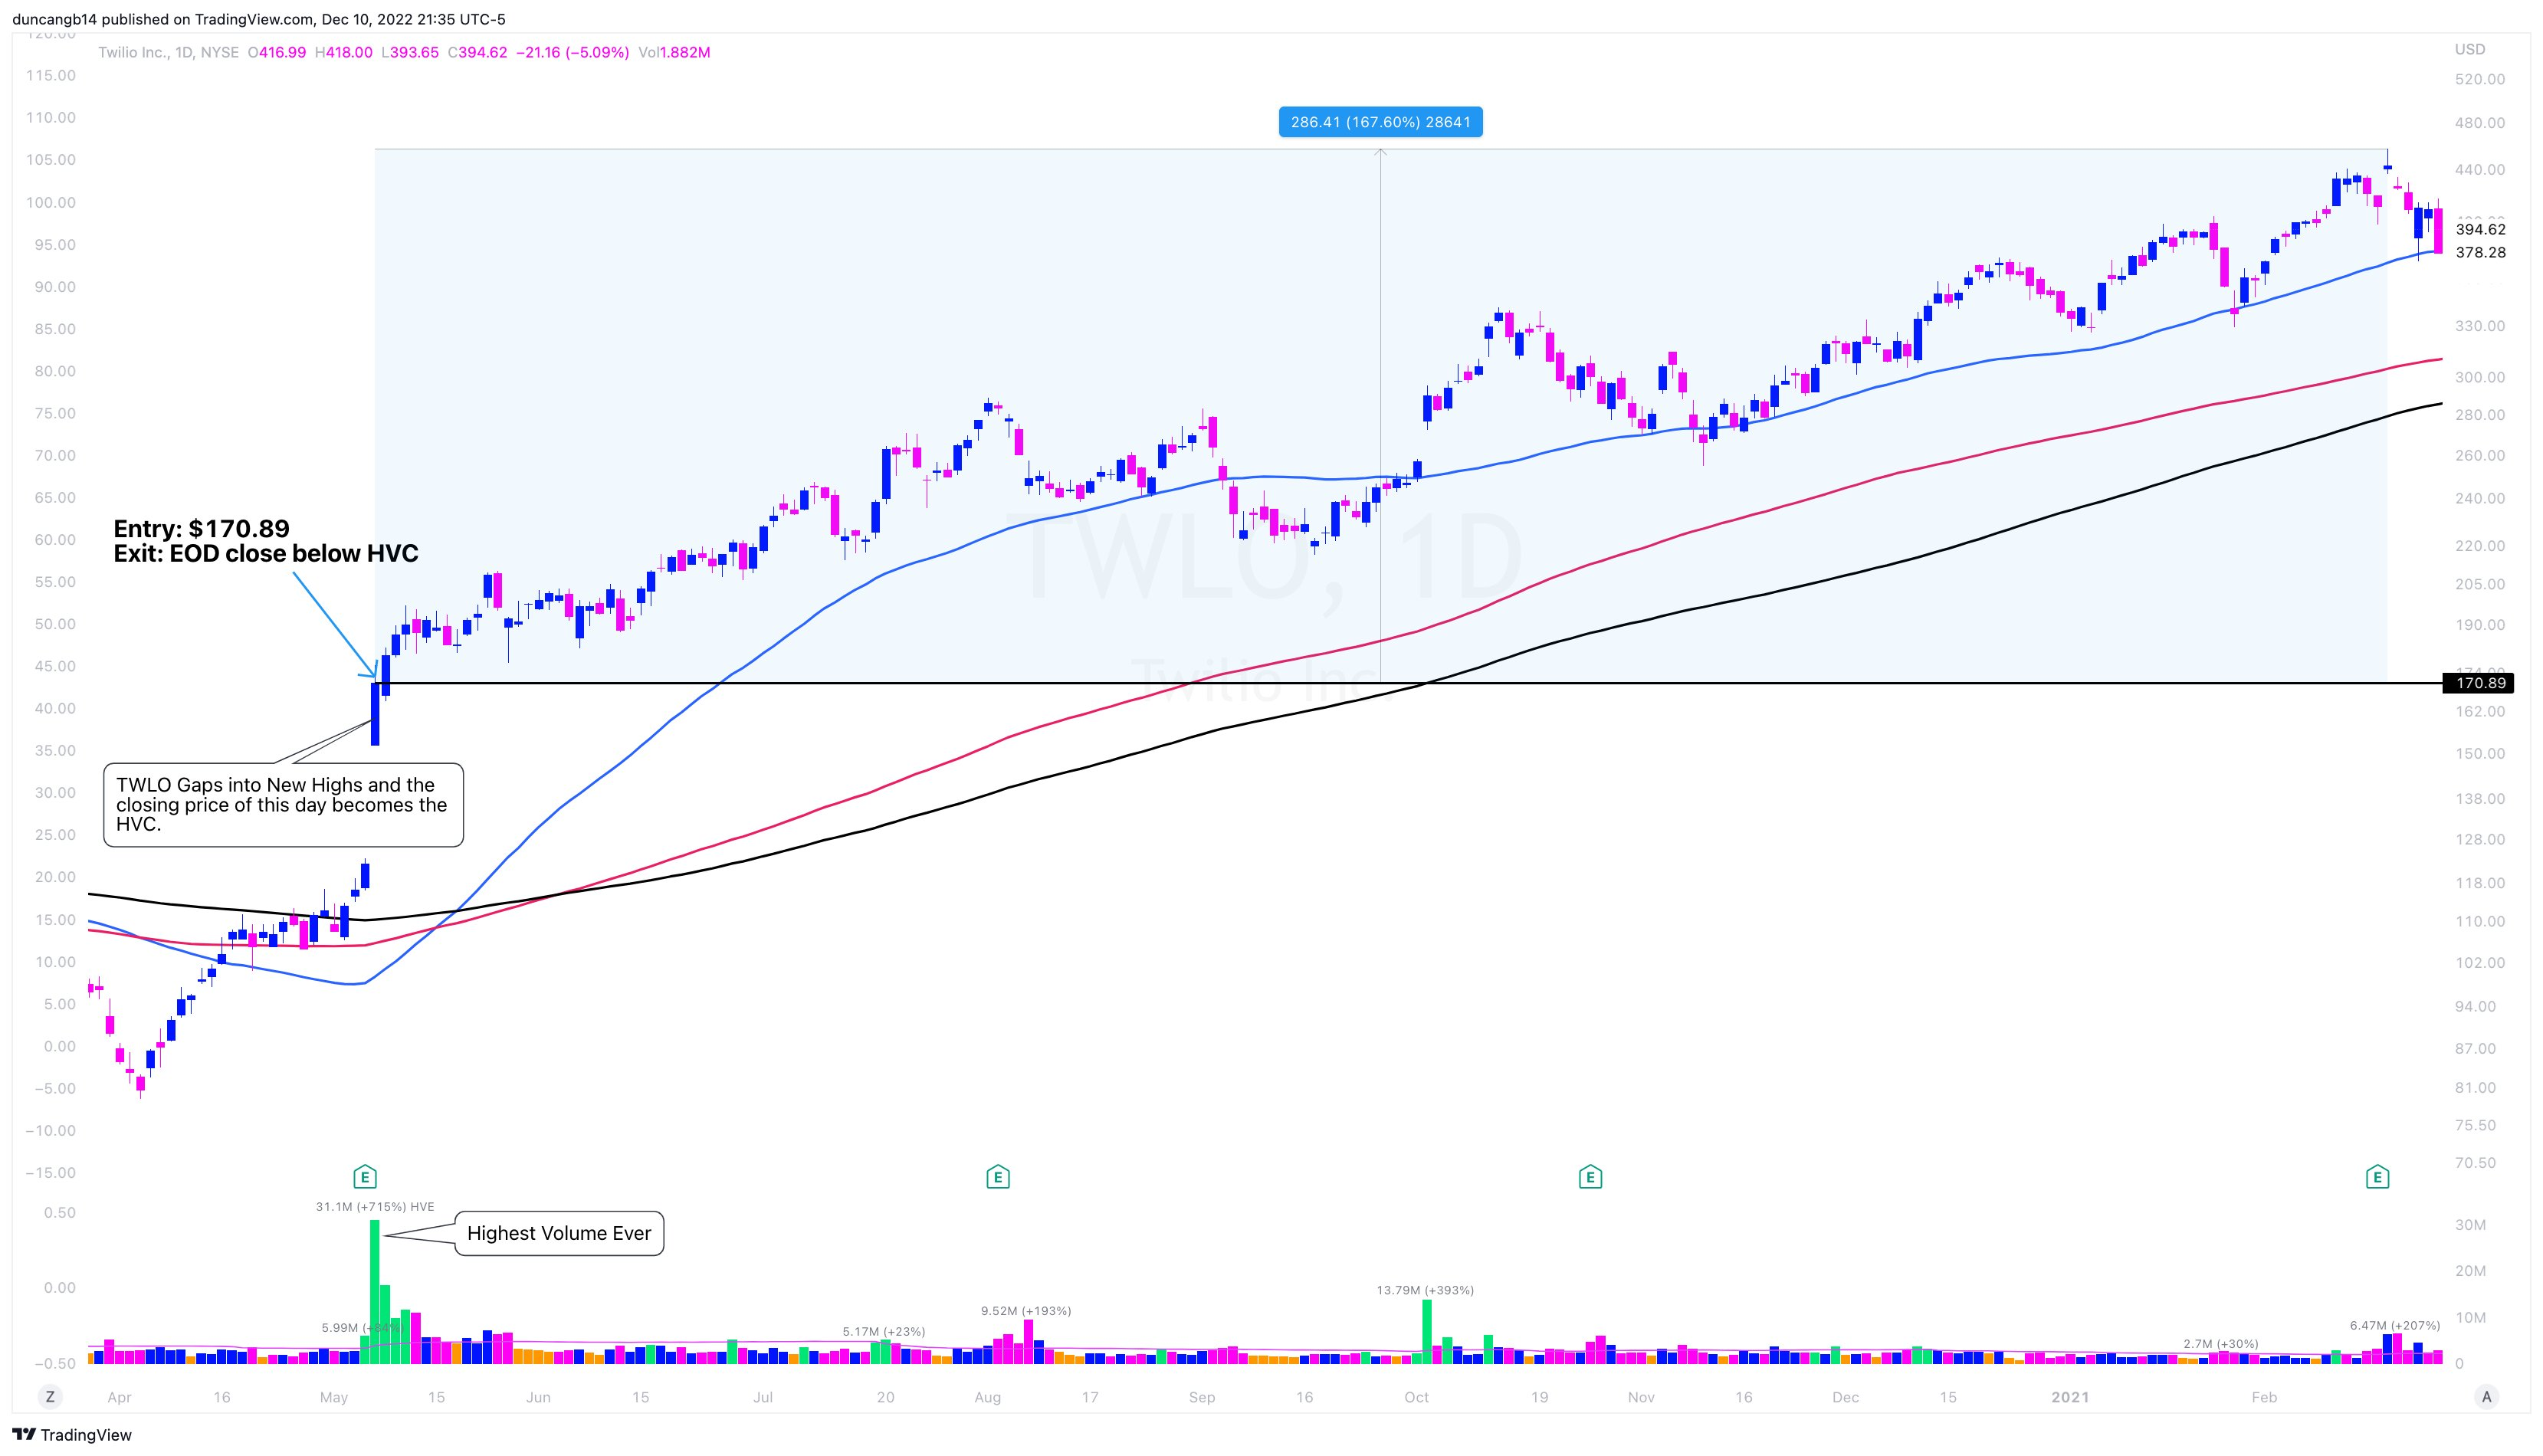
Key Traits:
· Highest Volume Ever
· Gap into new highs
· > 75% Daily Closing Range
· Day 2 works right through the HVC
· Price would run to +165%
Textbook action that works right from the start. Let’s look at another example.
$UPST but two separate instances!
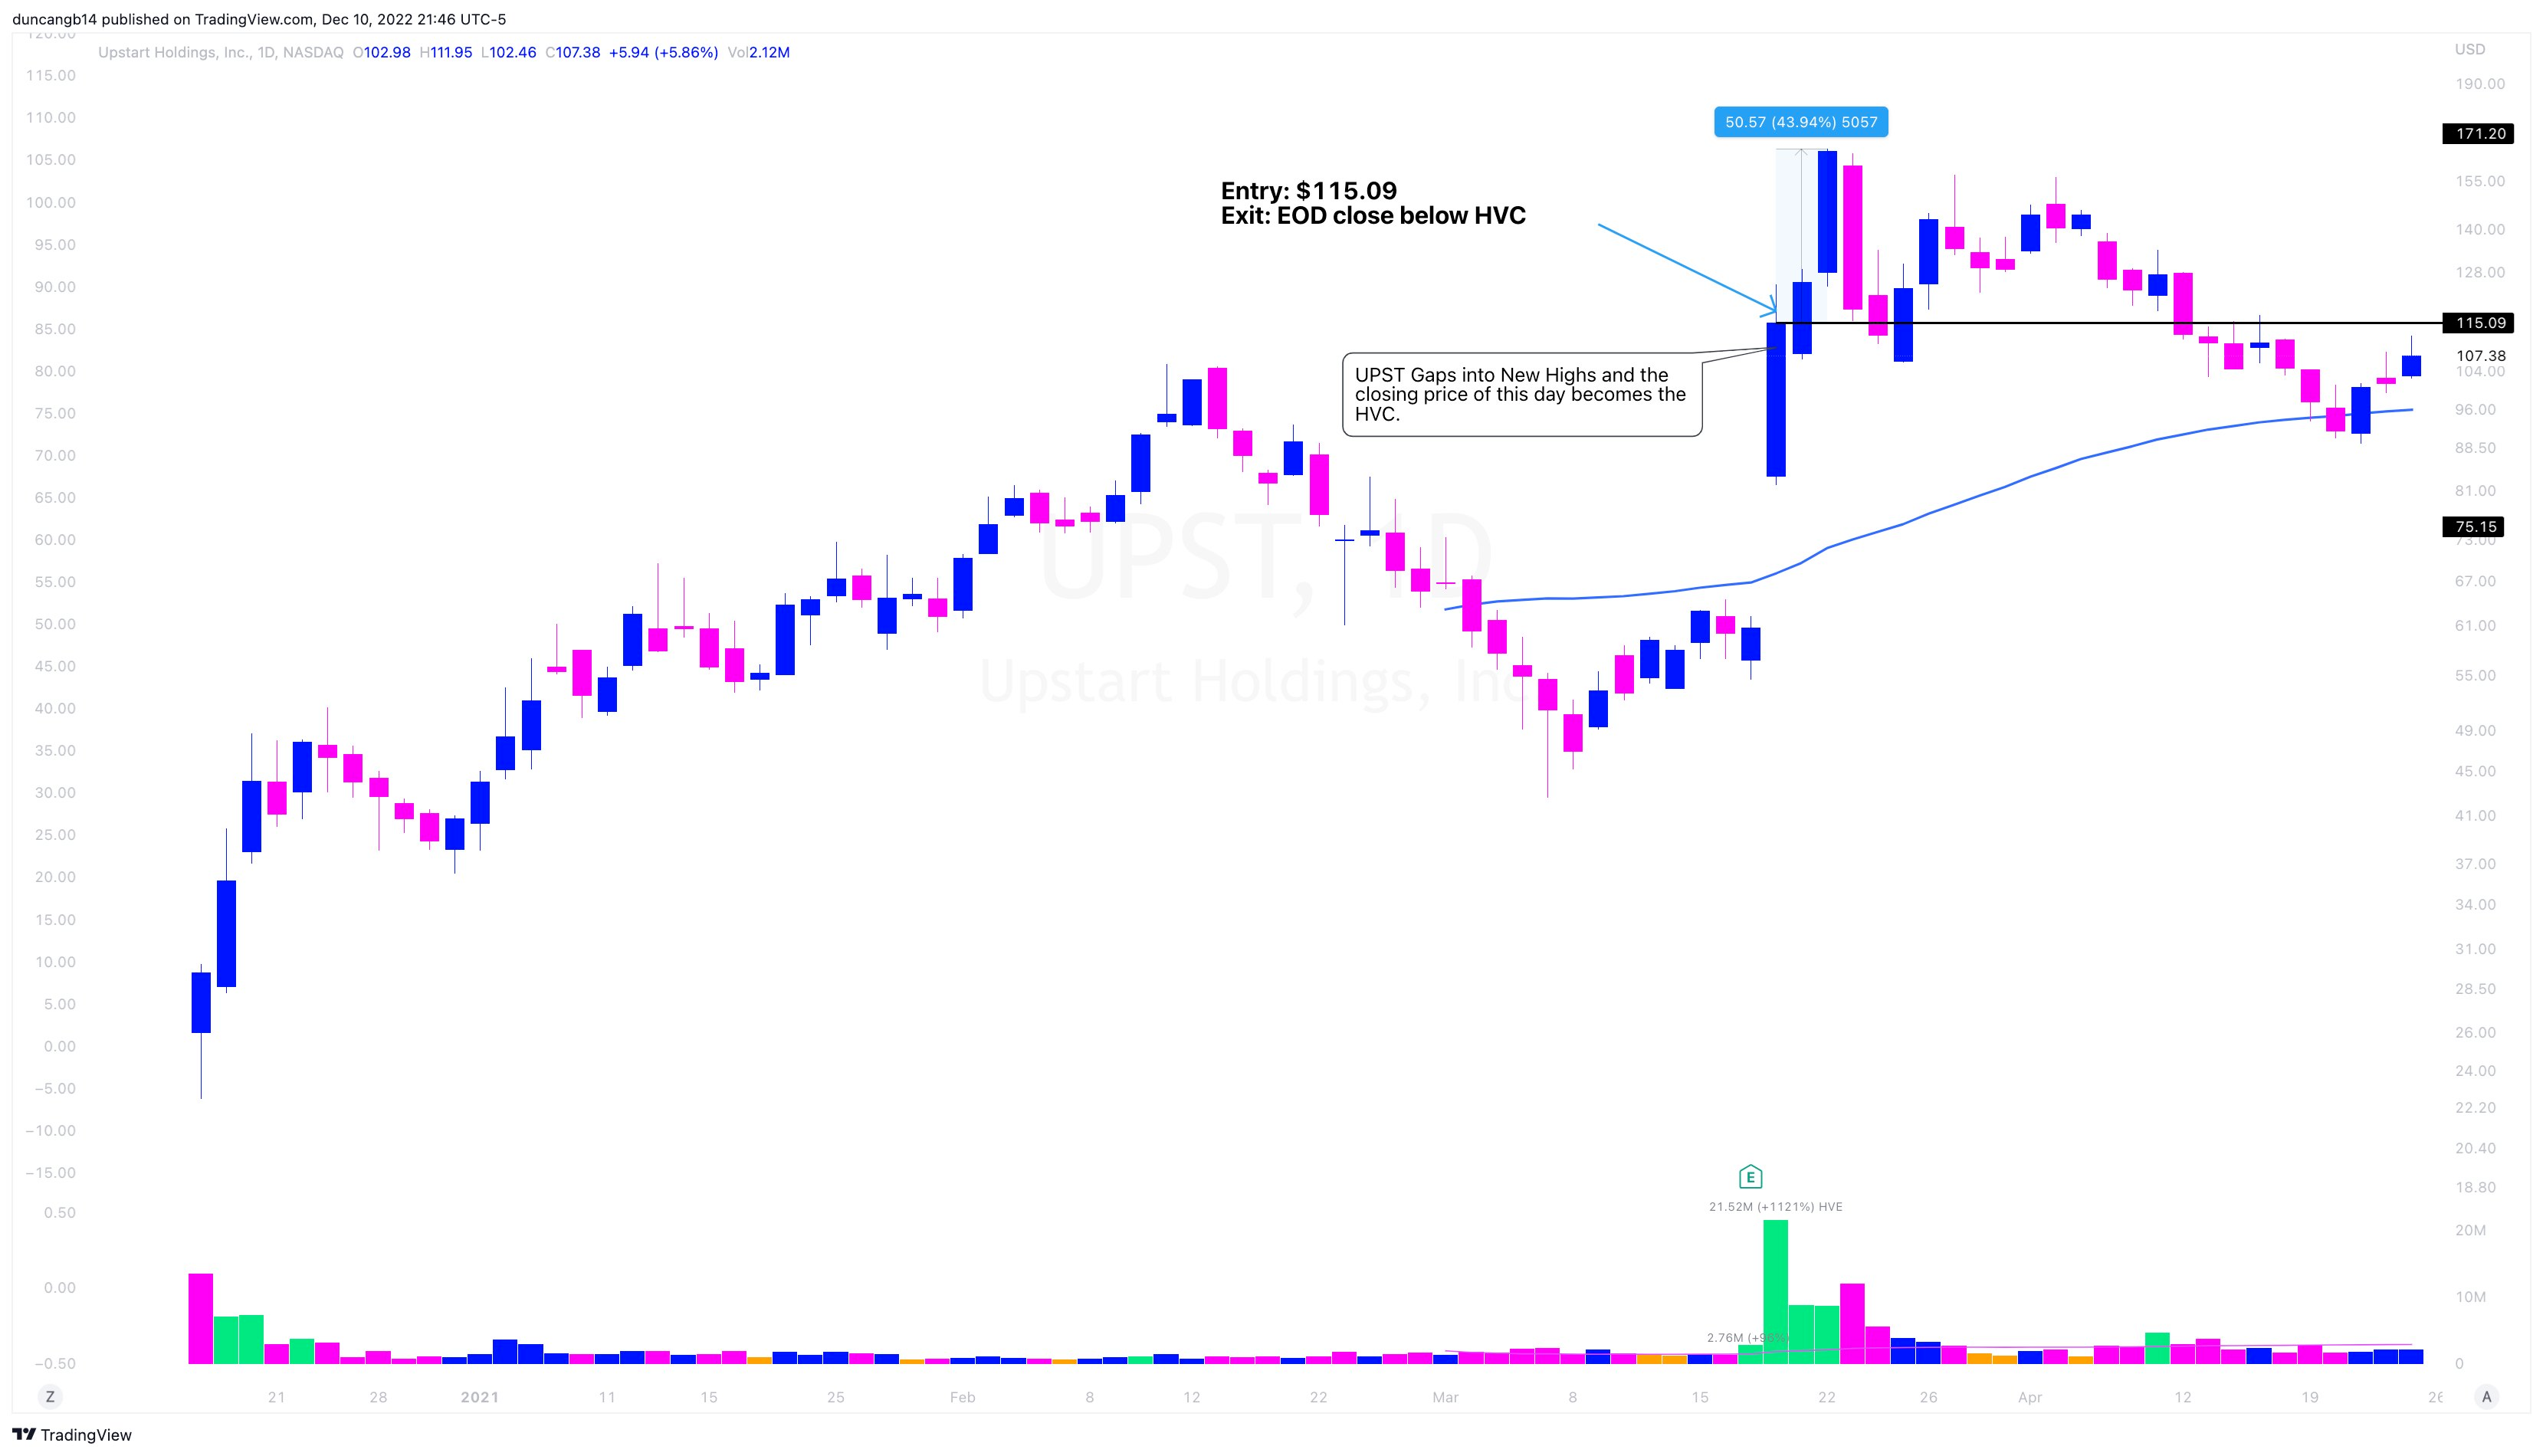
Chart 1:
· Highest Volume Ever
· Gap to New Highs
· > 75% Daily Closing Range
· Worked right from the get-go
· 43% Move in 2 Sessions
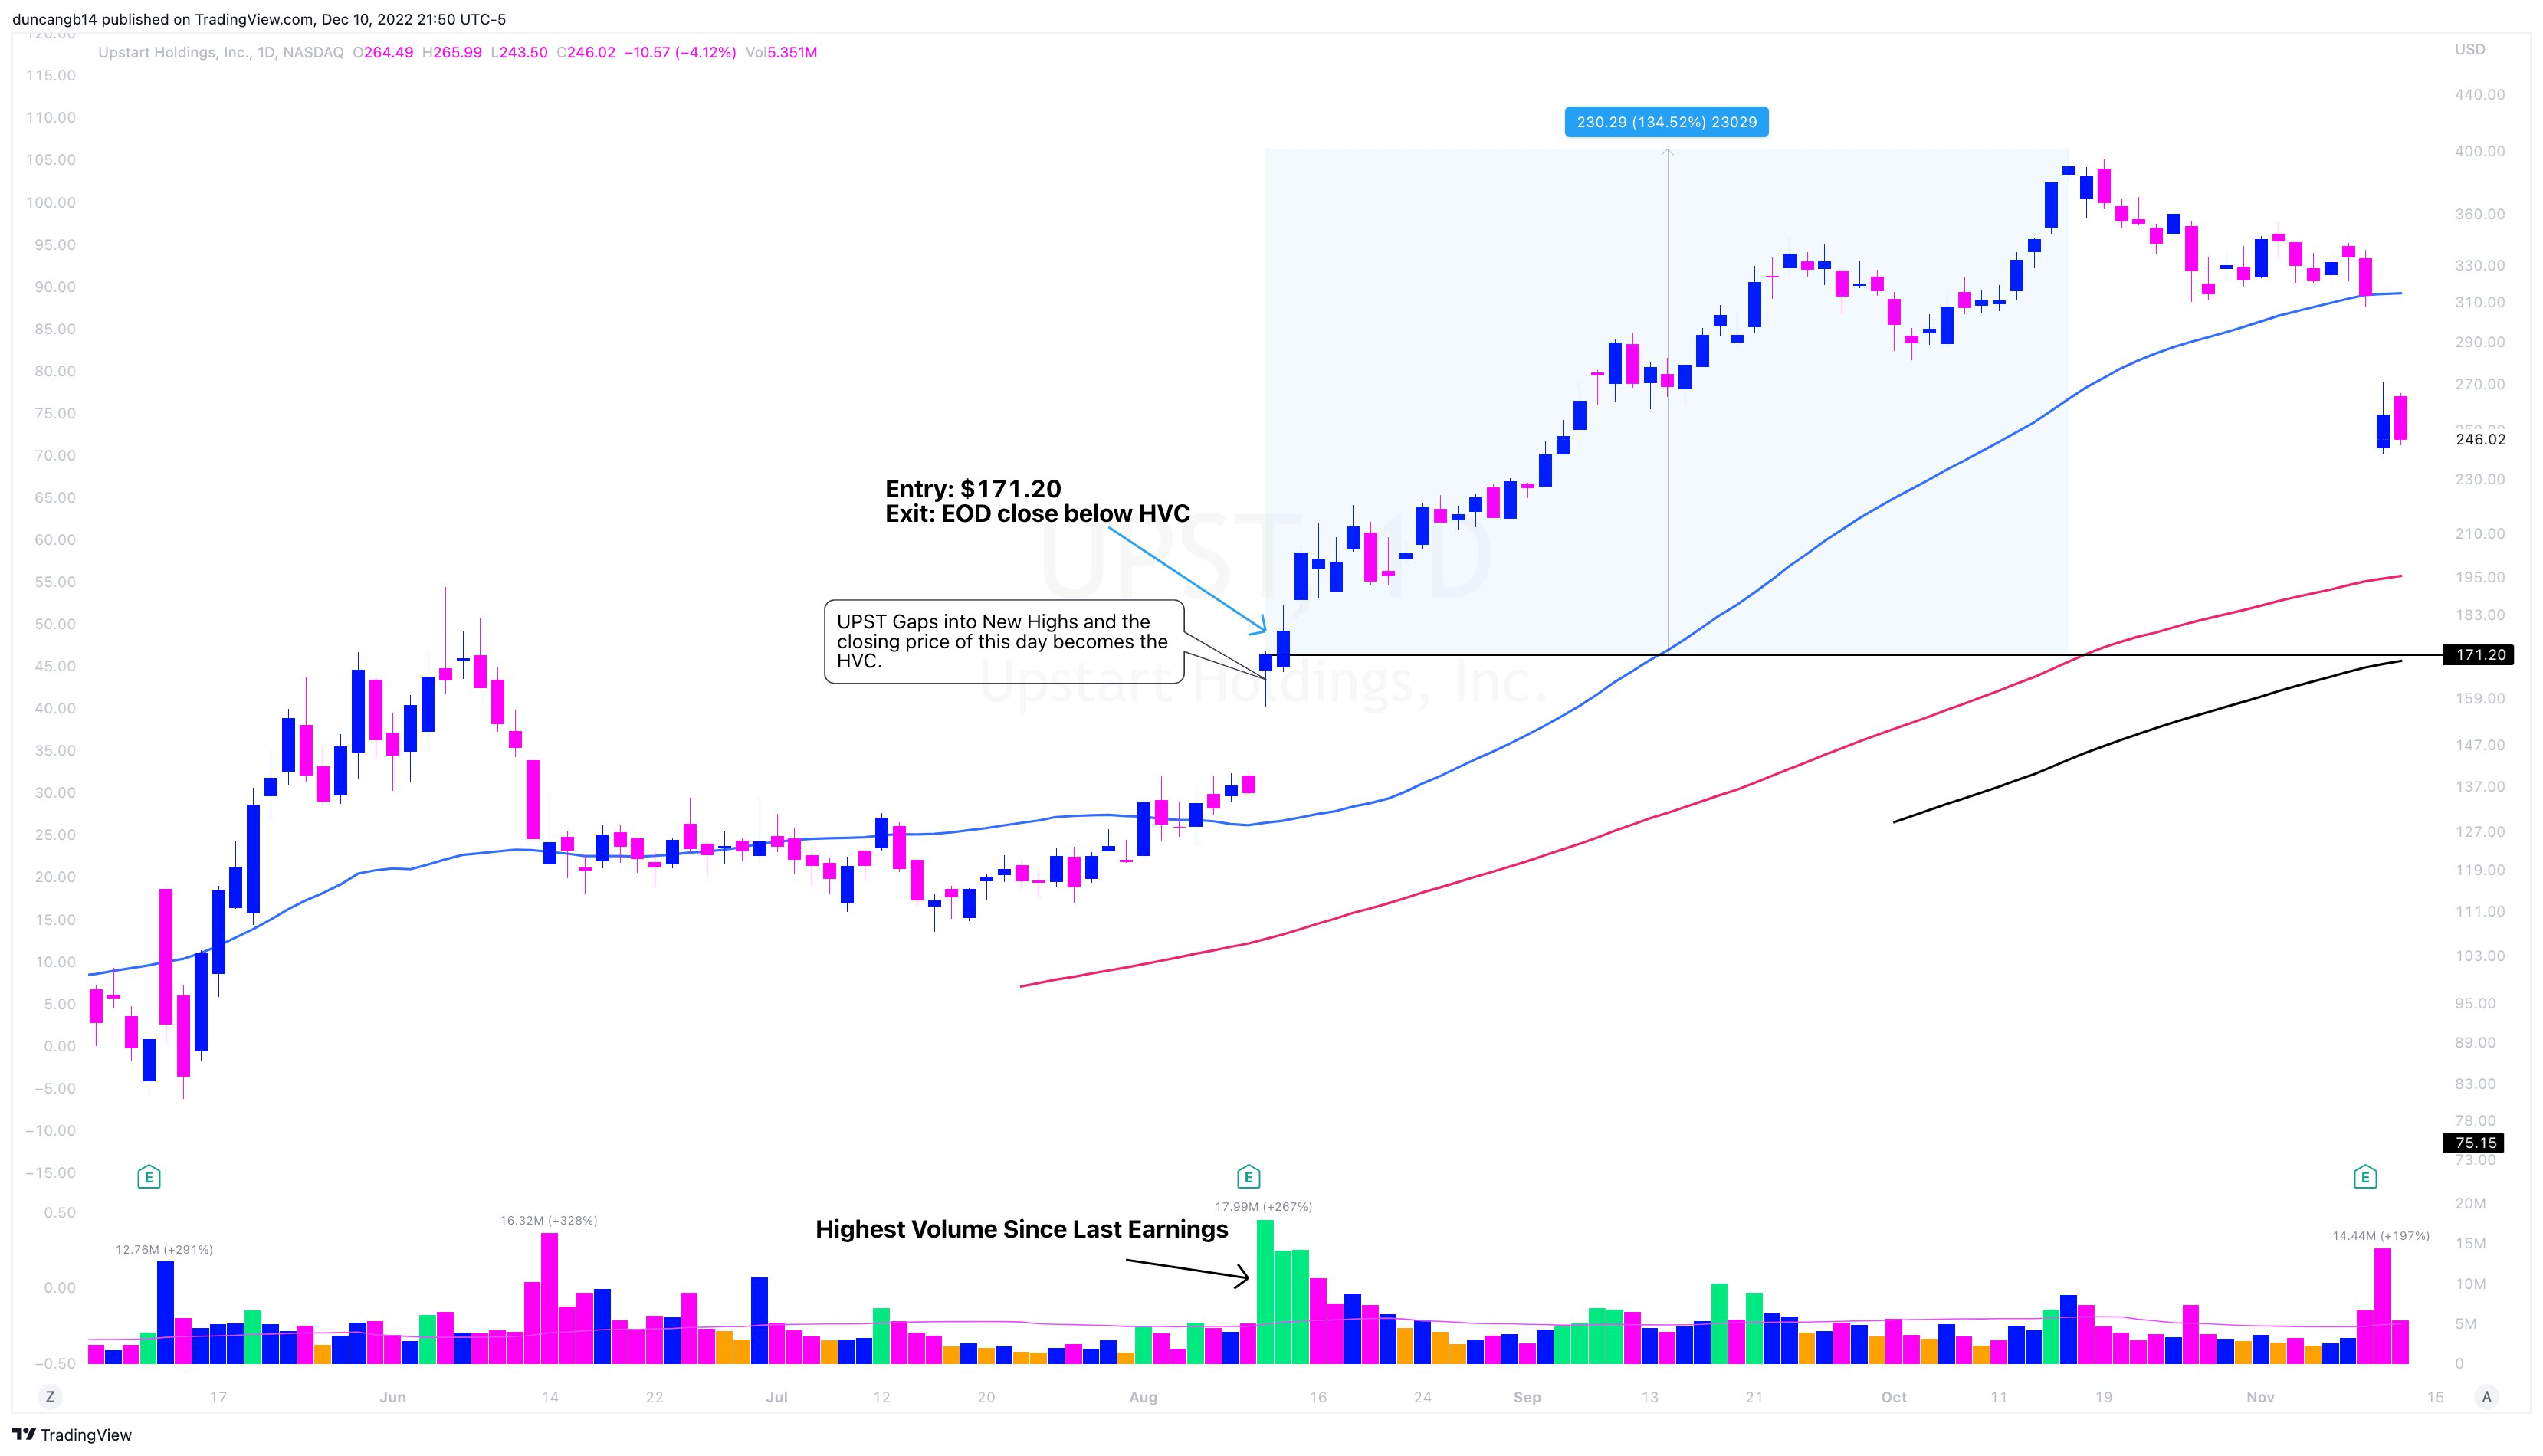
Chart 2:
· Highest Volume Since Last EPS
· Gap near prior highs
· > 75% Daily Closing Range
· Worked immediately
· +135% move in 2.5 months
Example #3: $DXCM
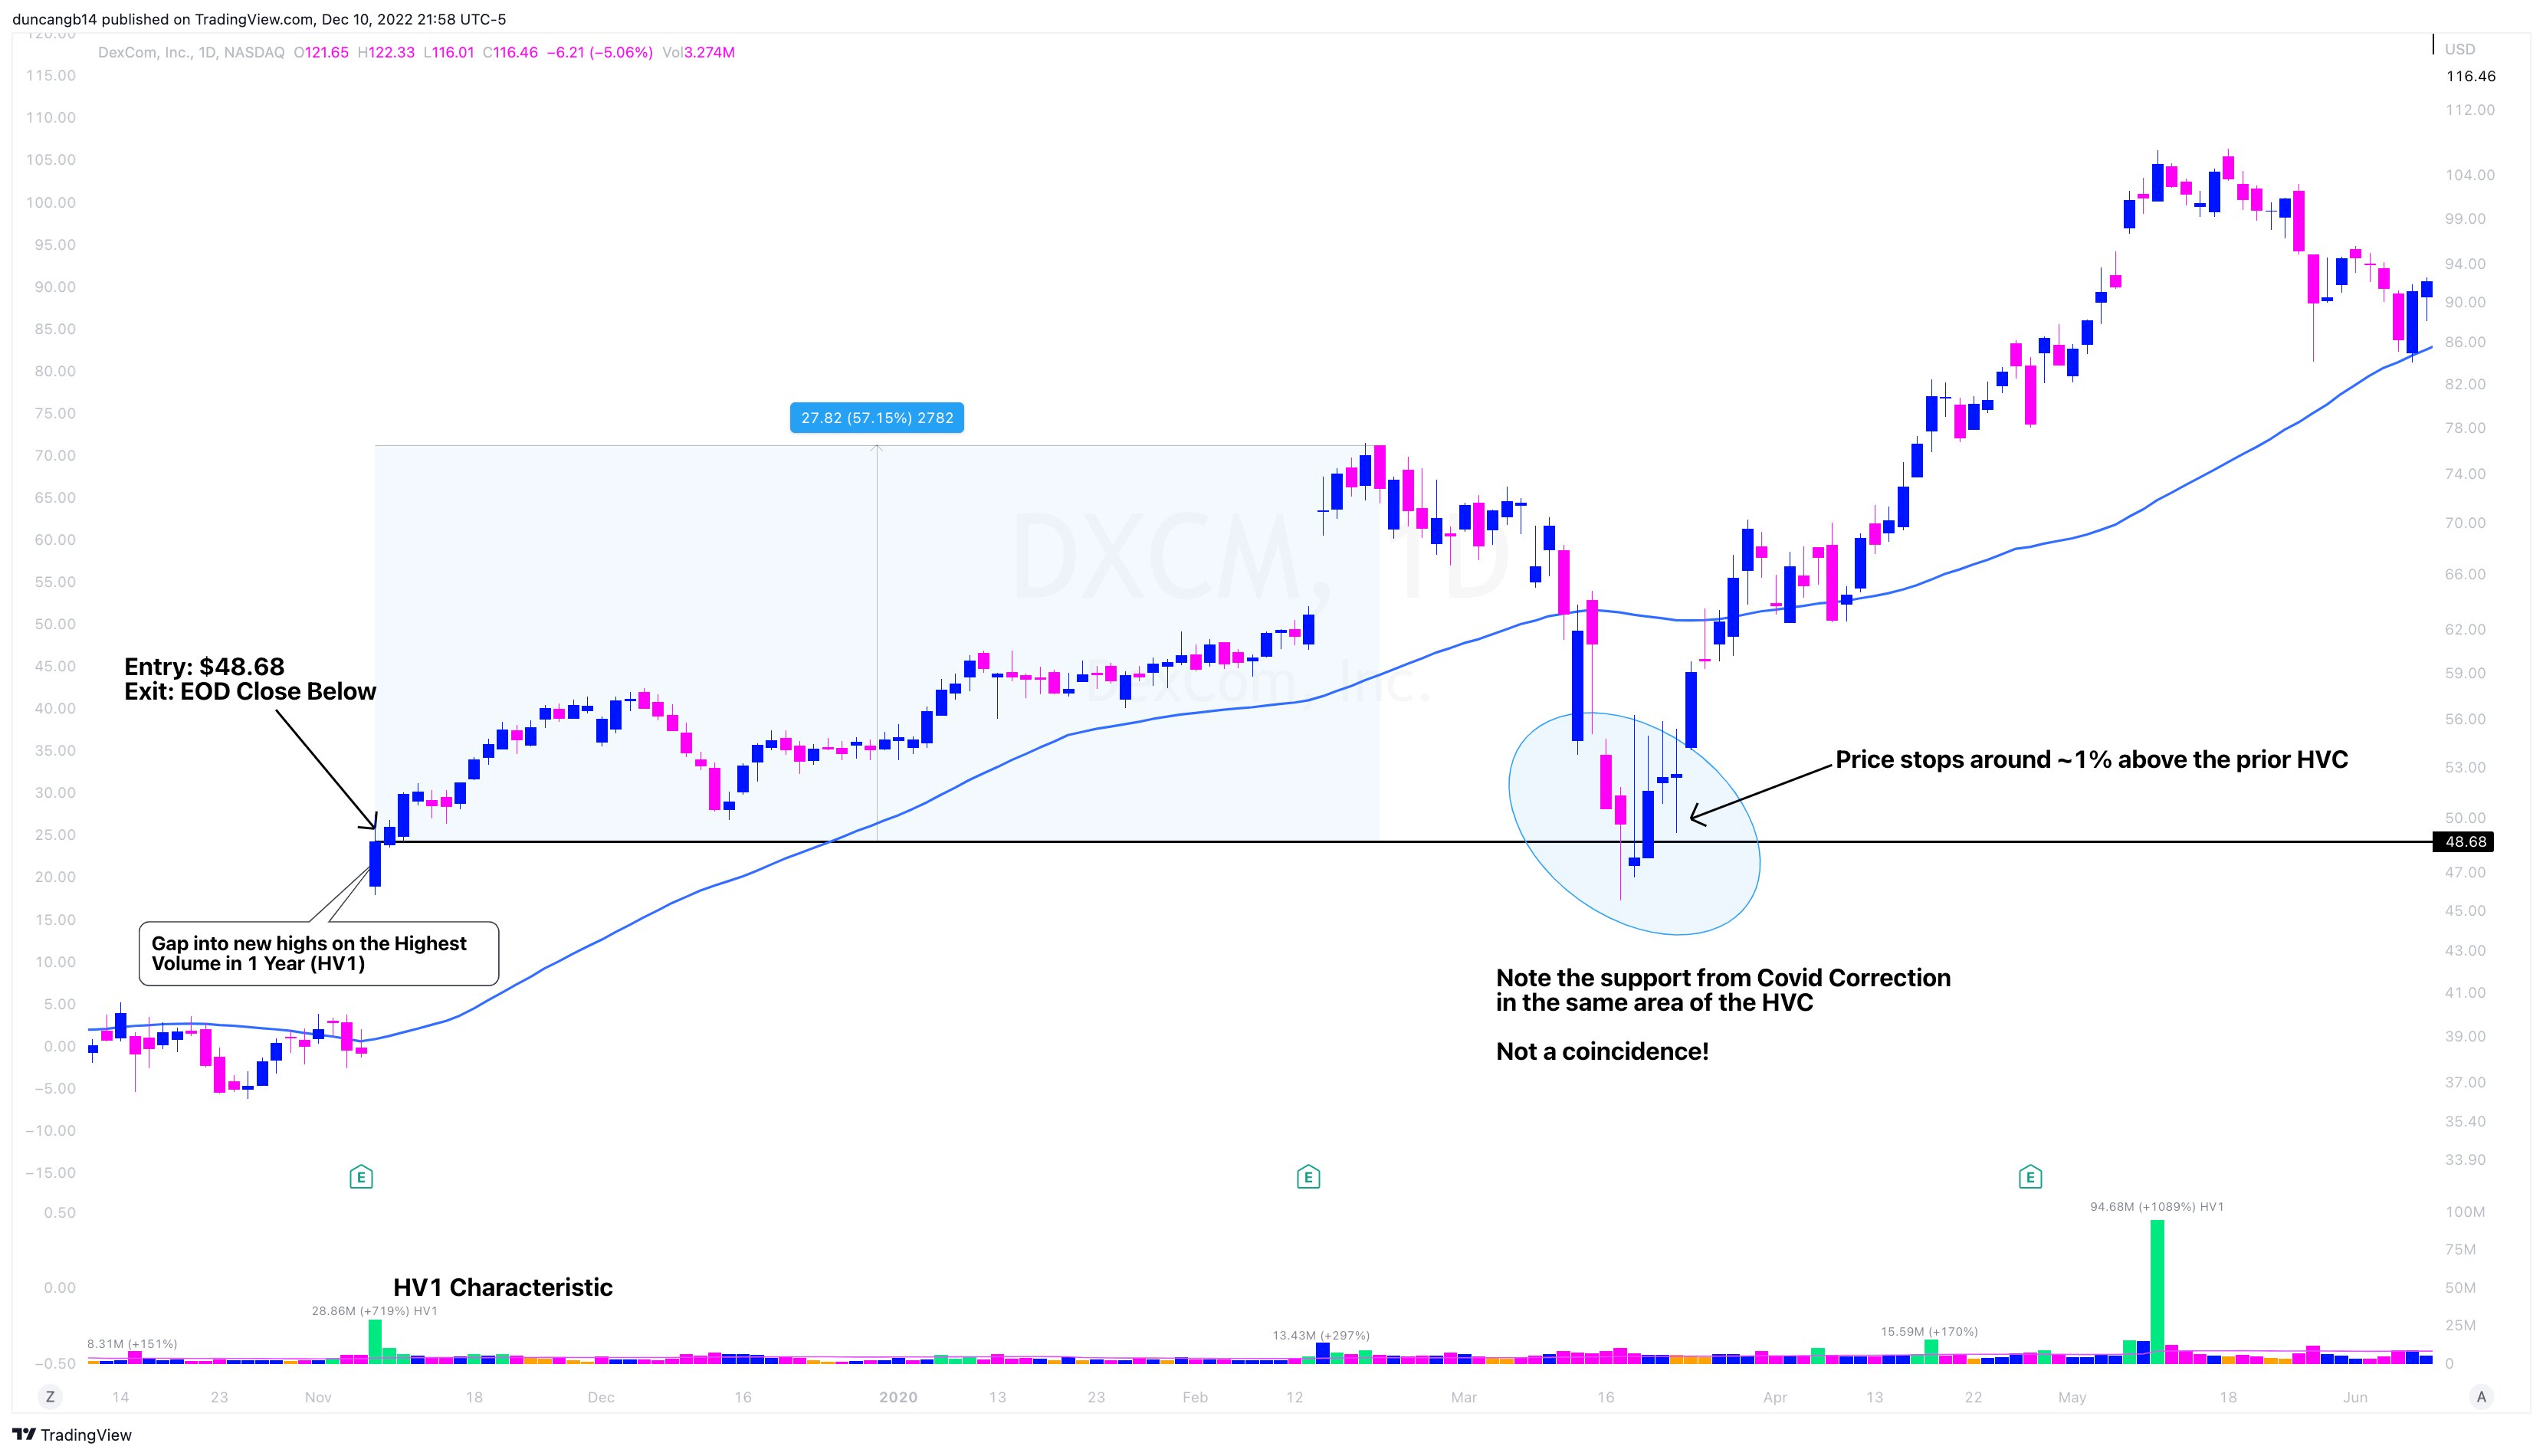
· Highest Volume in 1 Year
· Gap into highs
· > 75% DCR
· Immediately follows through for +55%
· Later finds support in this area during COVID correction
Example 4: $BROS
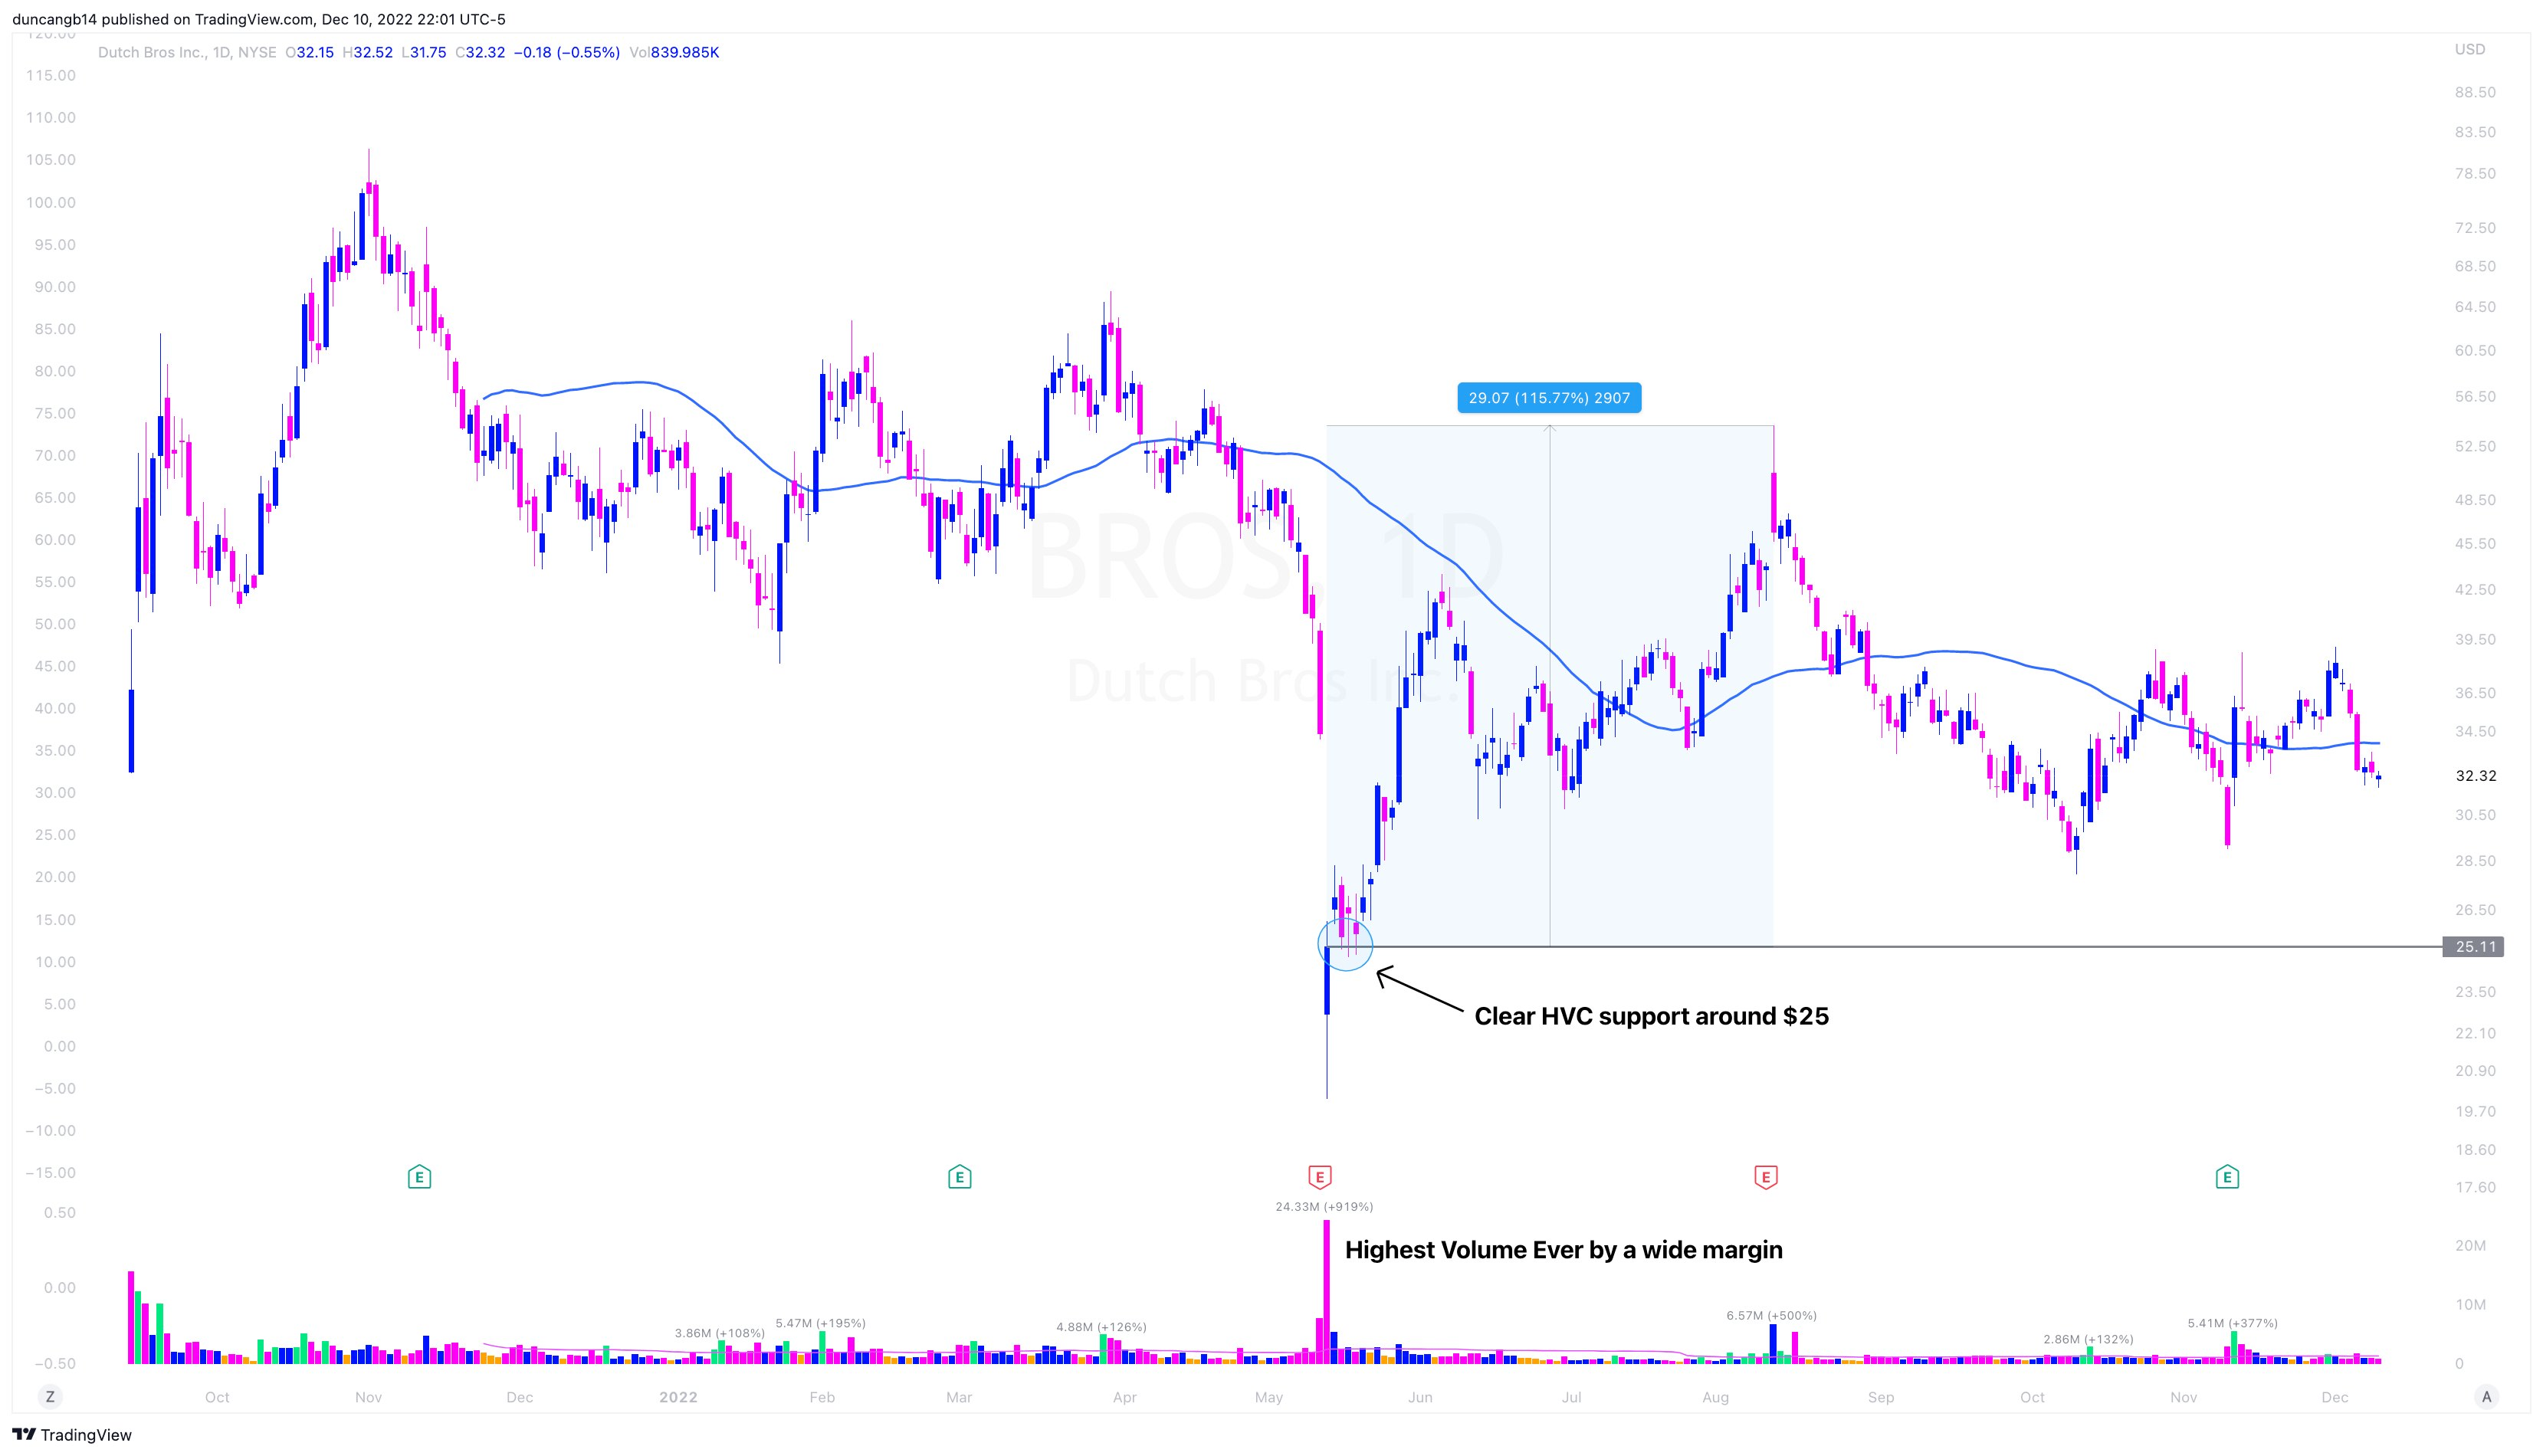
To throw a slight wrinkle BROS is an example of an HVE gap down that resolved to the upside. Let's look at the characteristics:
· HVE
· > 75% DCR
· Never closed below HVC
· +115% move
Just goes to show the edge works in a lot of different ways!
Entry/Exit Criteria for the HVC Setup:
Again, here are the entry and exit criteria that I use:
Entry: The High Volume Close
The closing price of the gap up on day 1 is the High Volume Close (HVC).
Exit: 3-5% hard stop below the HVC OR an end-of-day close below this level depending on the market environment.
If you want to study more HVC examples, I have compiled a google doc which you can find here:
Let's move on to the next pattern you MUST know:
2. Inside Day & Up Pattern
My second favorite pattern in the market is the inside day and up pattern.
This is an amazing tactic to capture short-term moves and is one I can implement in most market environments, especially if my holding period is only a couple of sessions max.
Main criteria:
The main scanning criteria I look for are the following:
· Inside Day (today's whole price bar within yesterday's)
· Below-average volume
· Tight chart pattern previous to today
That's it! Here are potential entry and exit tactics:
Entry: The prior day's high or the nearest longer-term breakout level.
Exit: Inside Day's low.
The goal is to keep risk manageable with a 3-5% stop (and less if possible!)
Examples:
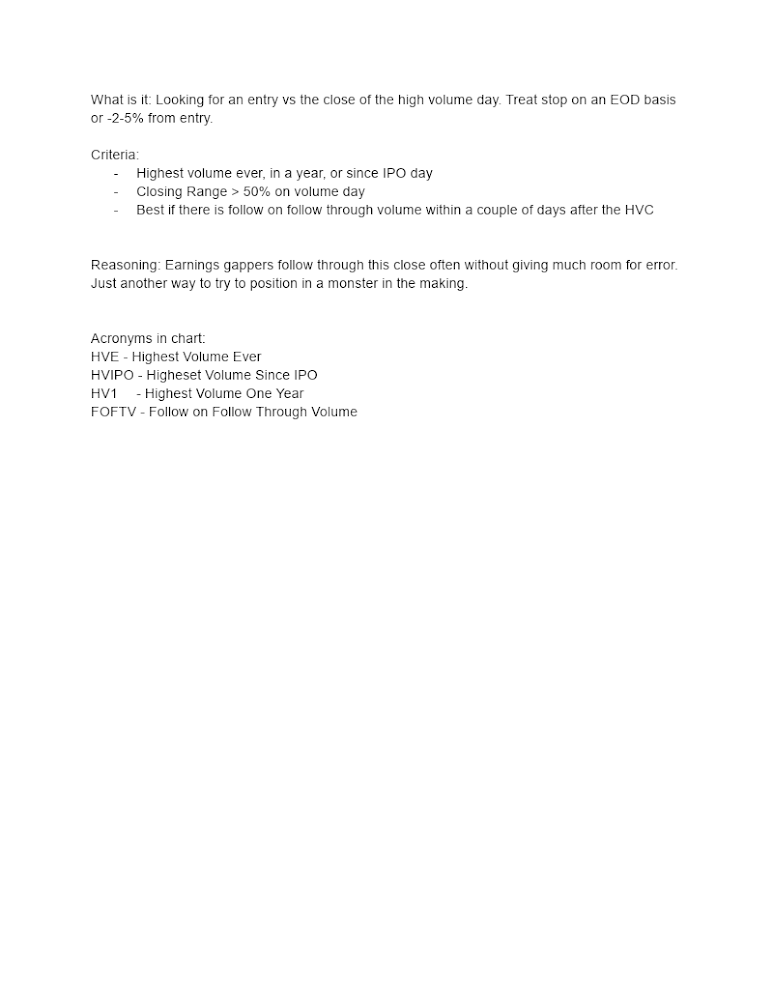
Example #1: $ROKU
· Inside Day
· Consolidate on Low Volume
· Explode on Increased Volume
From this inside day, ROKU would go on to top out at $486.72 while riding the 50-day the whole way up, equivalent to a 256% gain.
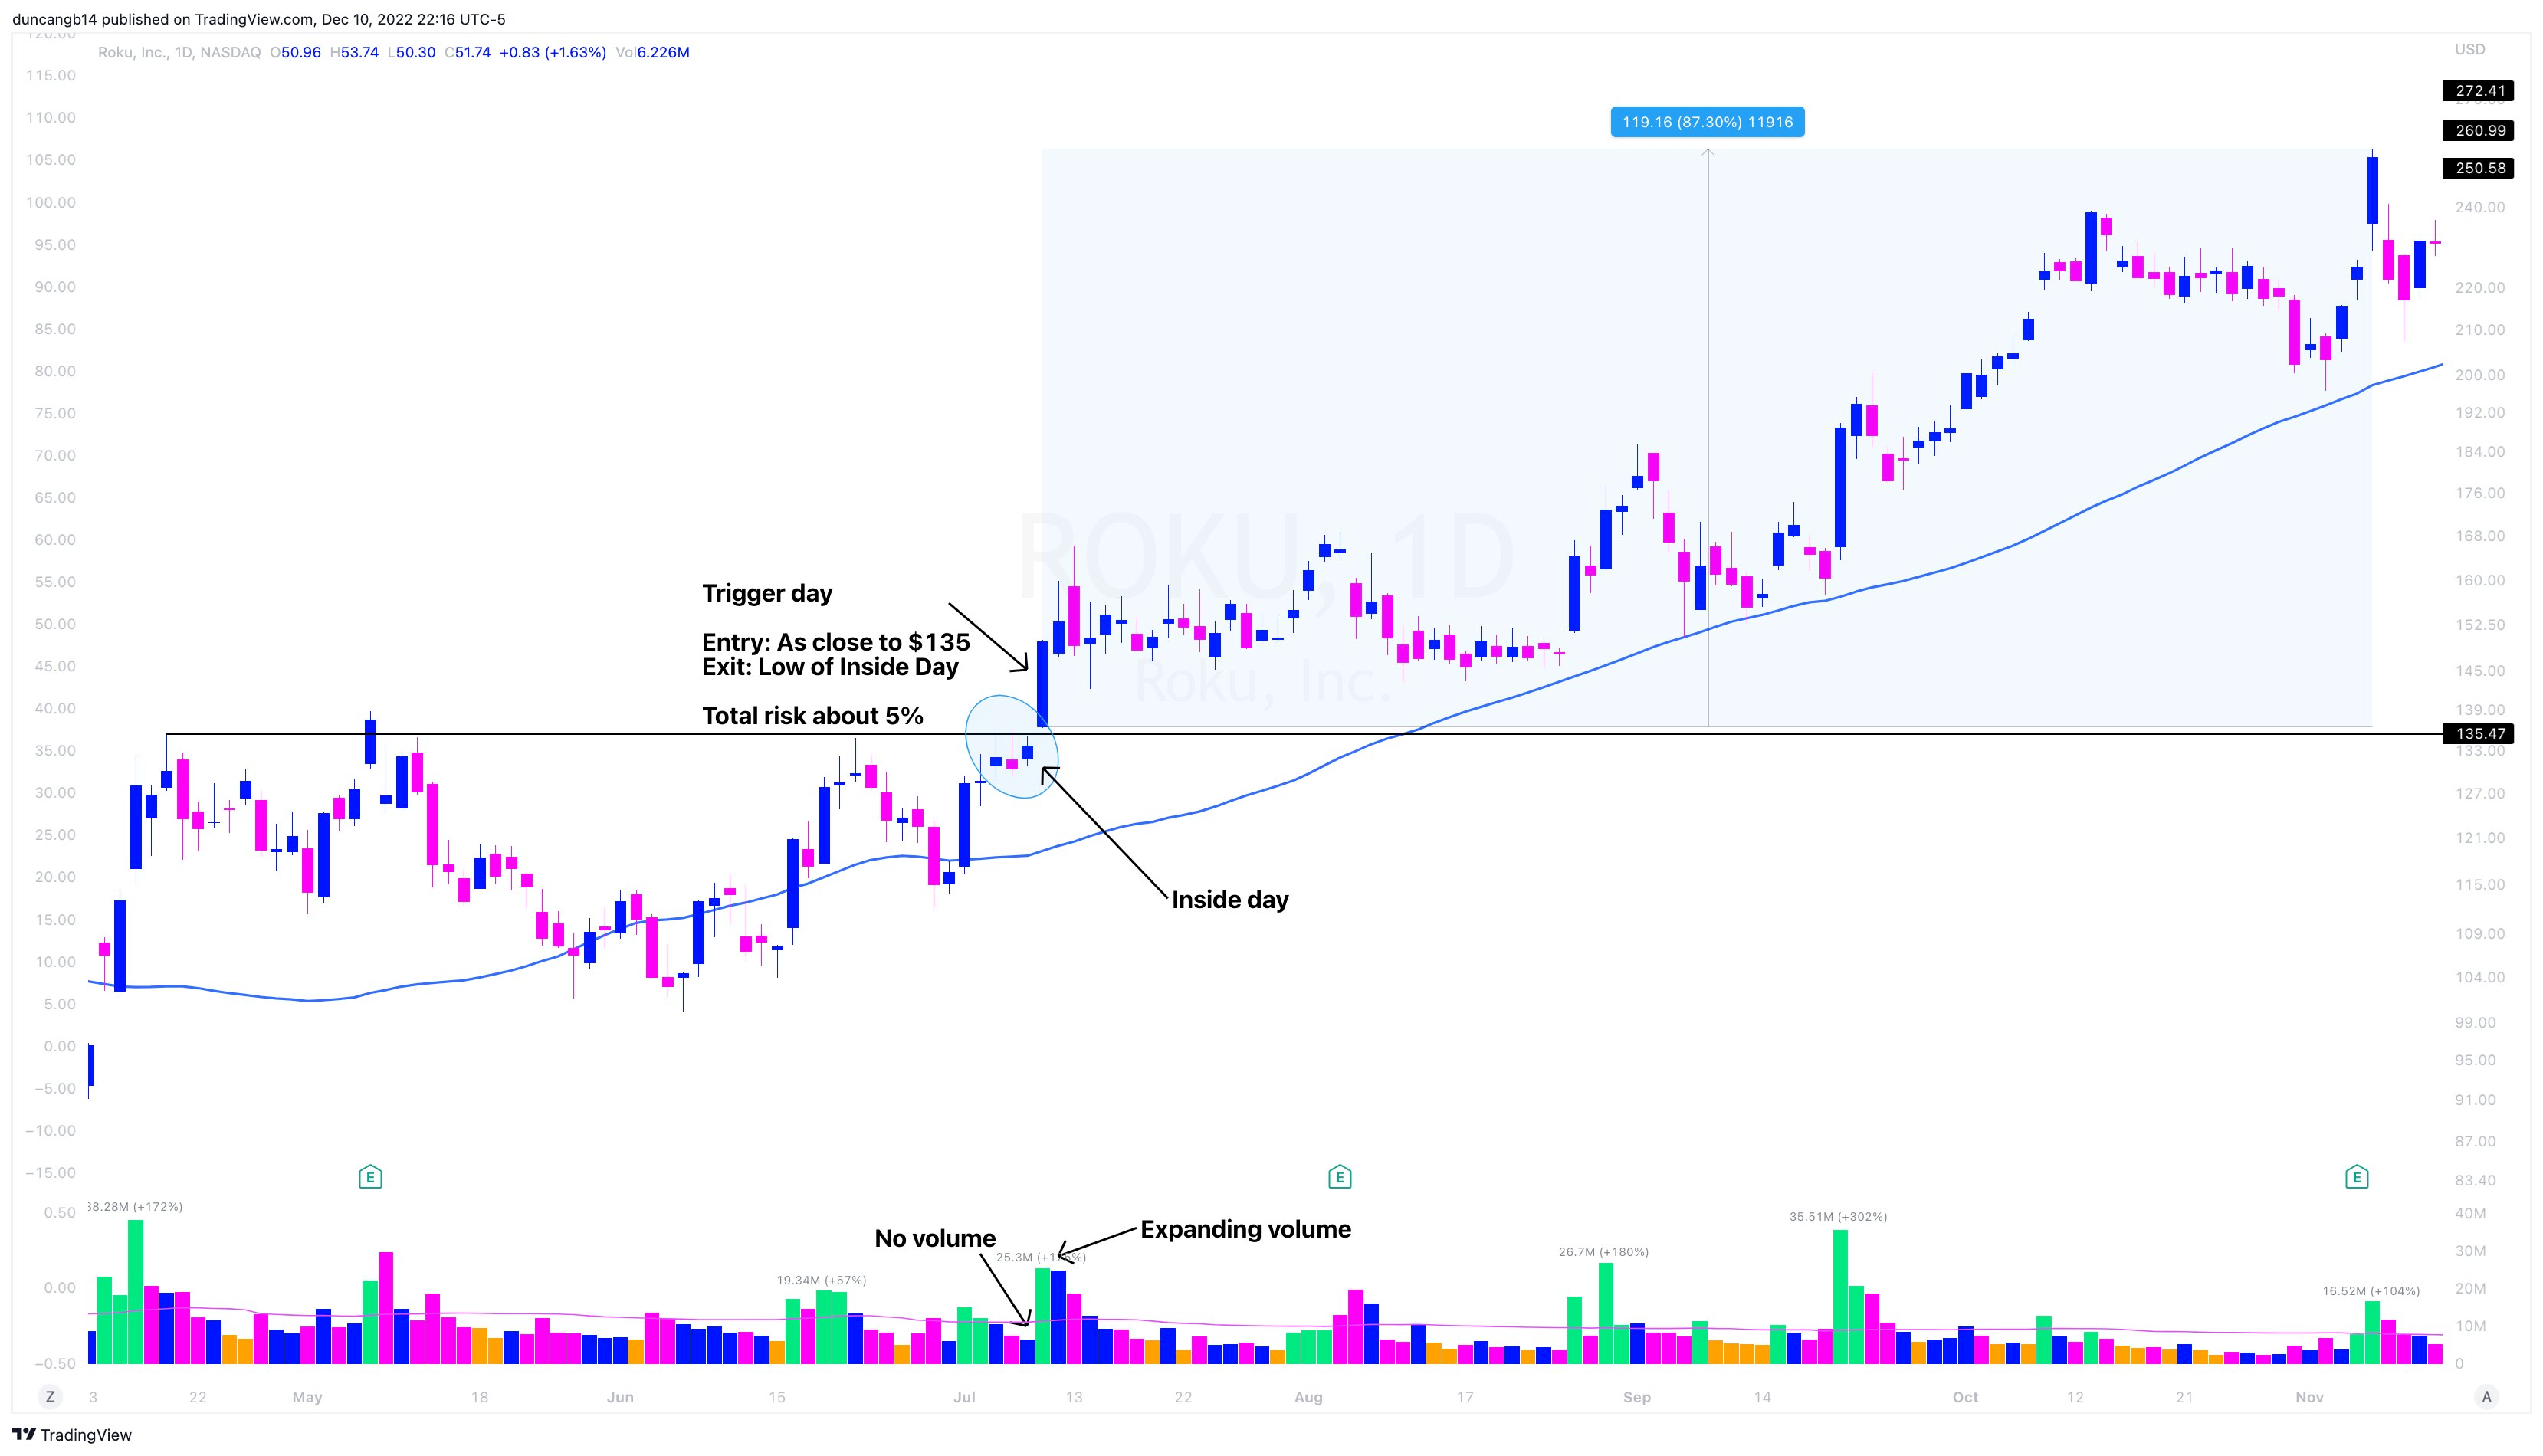
Example #2: $PLTR
· Inside Day
· Consolidate on Low Volume
· Explode on Increased Volume
PLTR would go on to run +300% from this inside day and up setup.
Example 3: $AMD
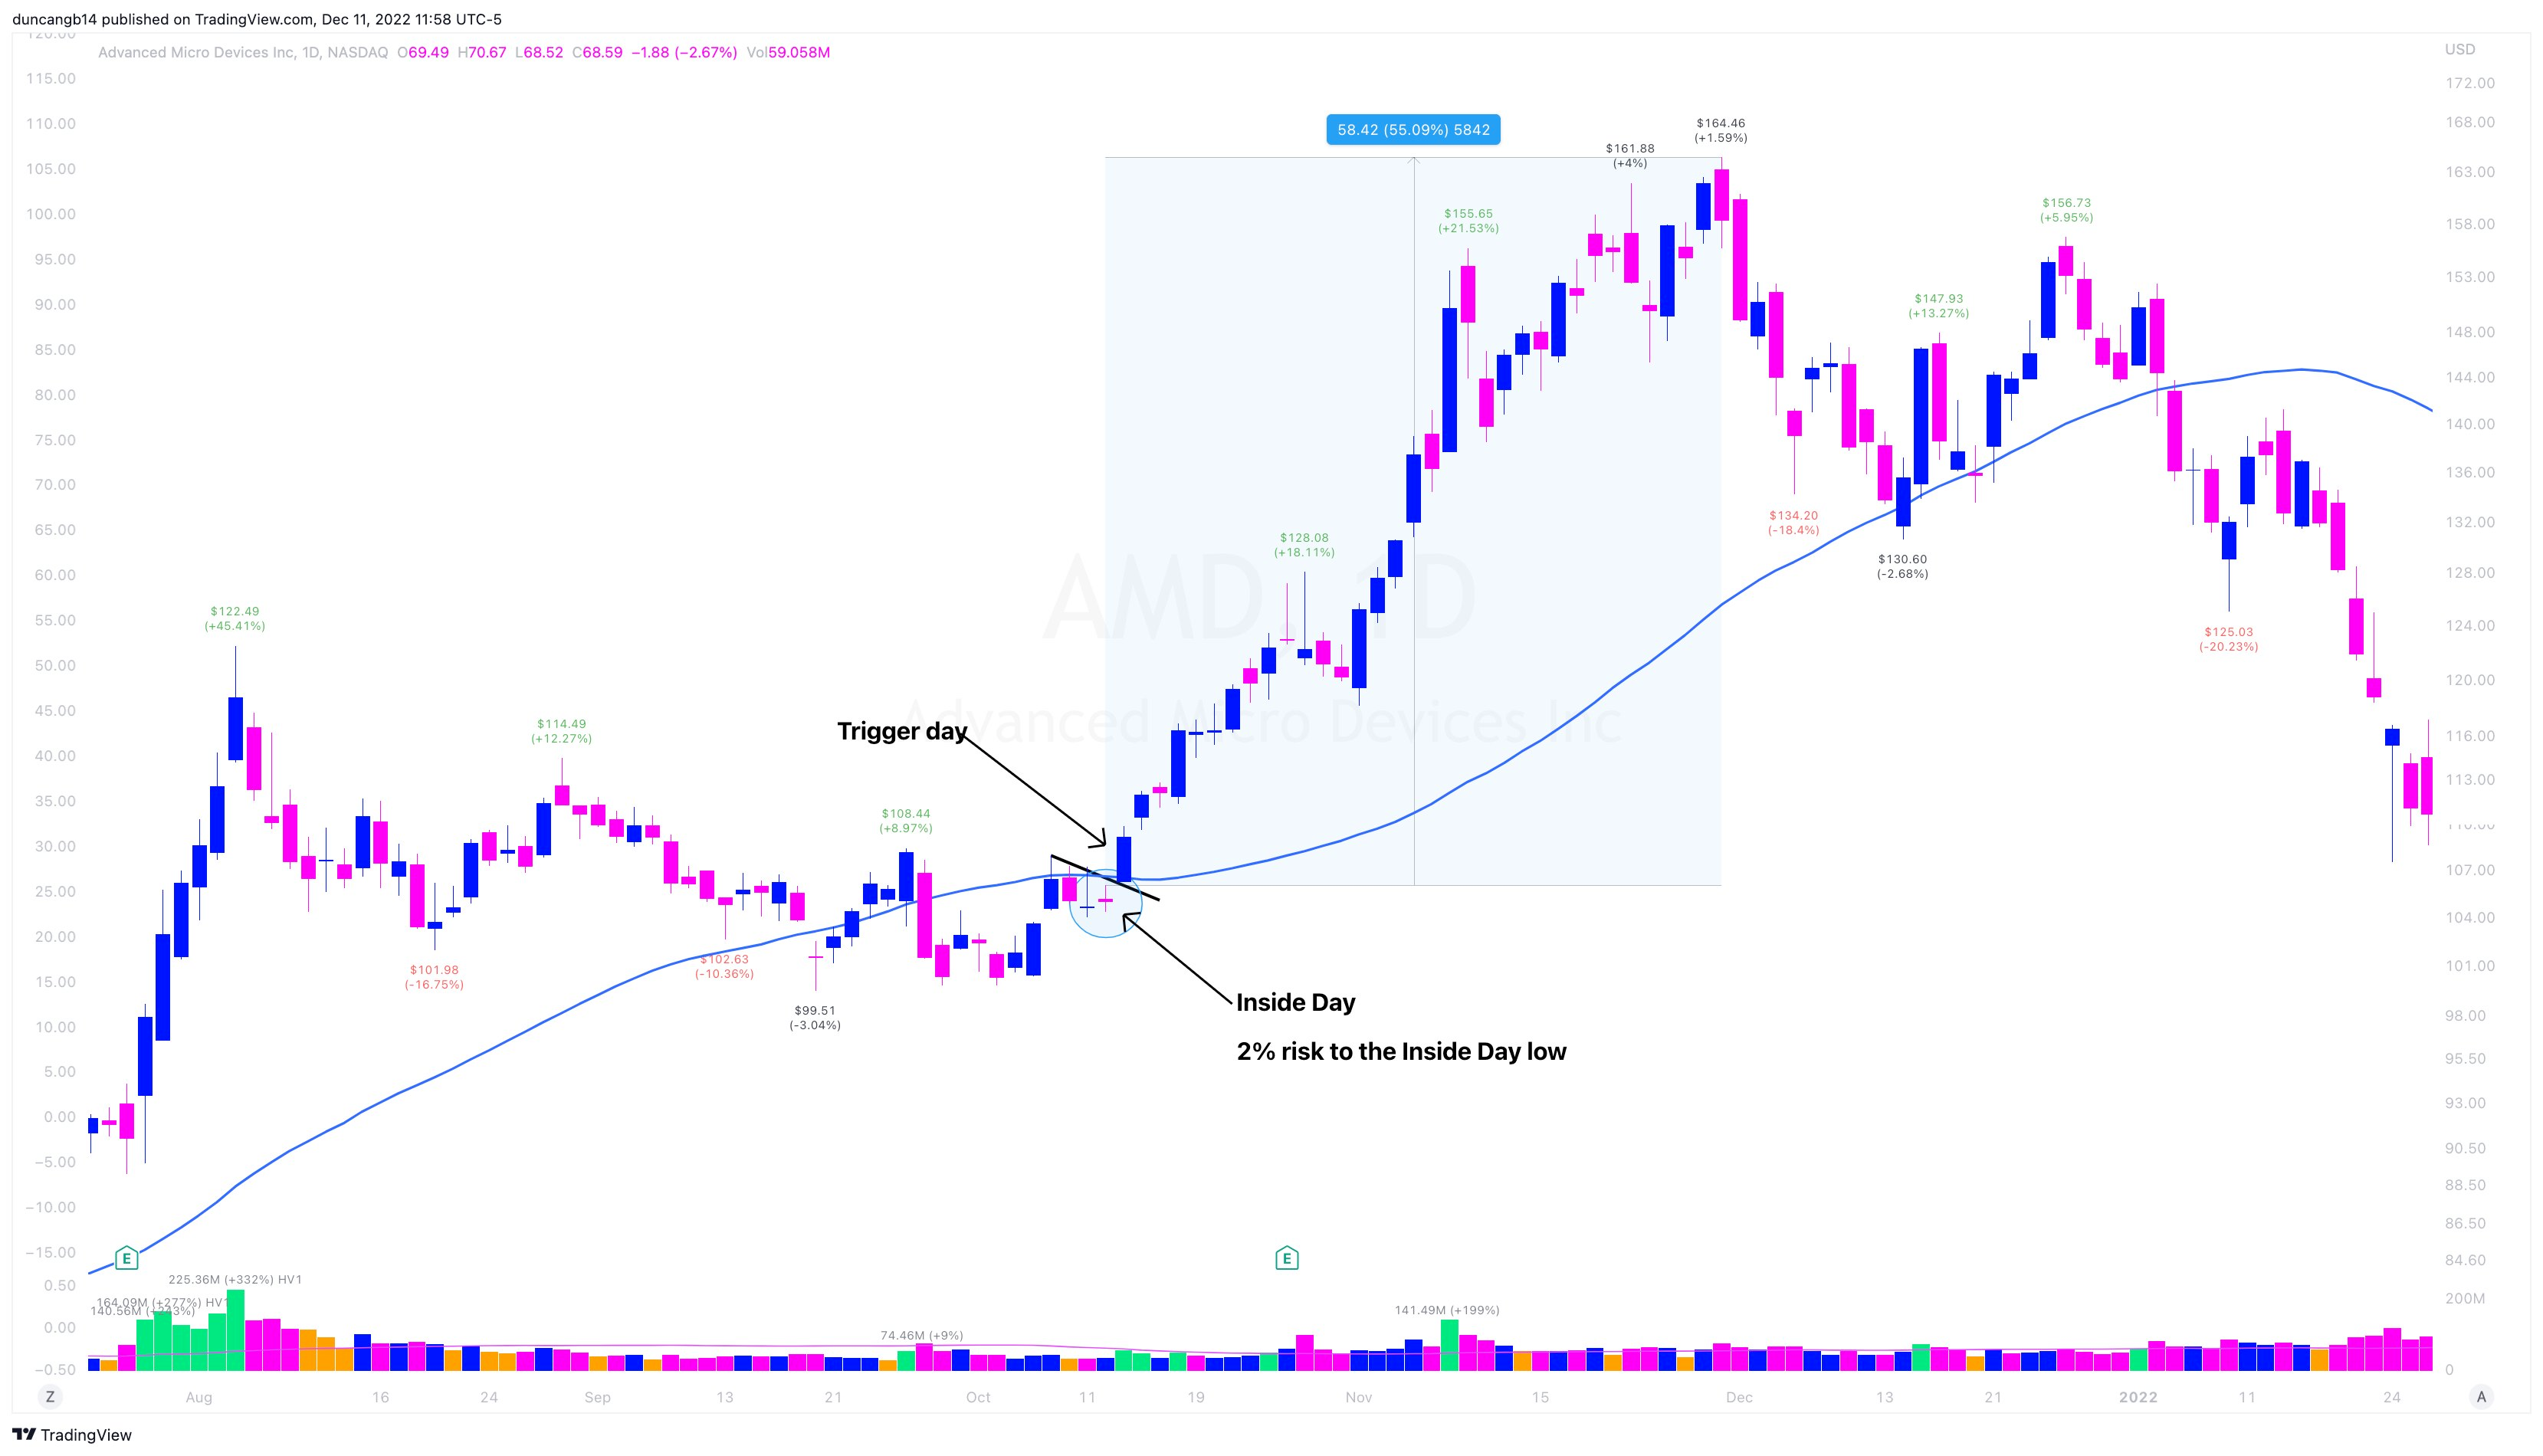
· Inside Day
· Consolidate on Low Volume
· Explode on Increased Volume
This setup led to a 55% gain in only a matter of weeks!
3. Key Moving Average Pullback
The last setup you must know as a trader is the Moving Average Pullback. The point of this setup is to capture weakness in leading stocks as they find support from institutions on the 10-week moving average.
Key Characteristics:
· Stock should be pulling back from new highs (52-week or all-time)
· Uptrending 10-week Moving Average
· Volume should be low on a pullback
· Buy occurs after stock reverses higher
Examples:
Example 1: $TSLA
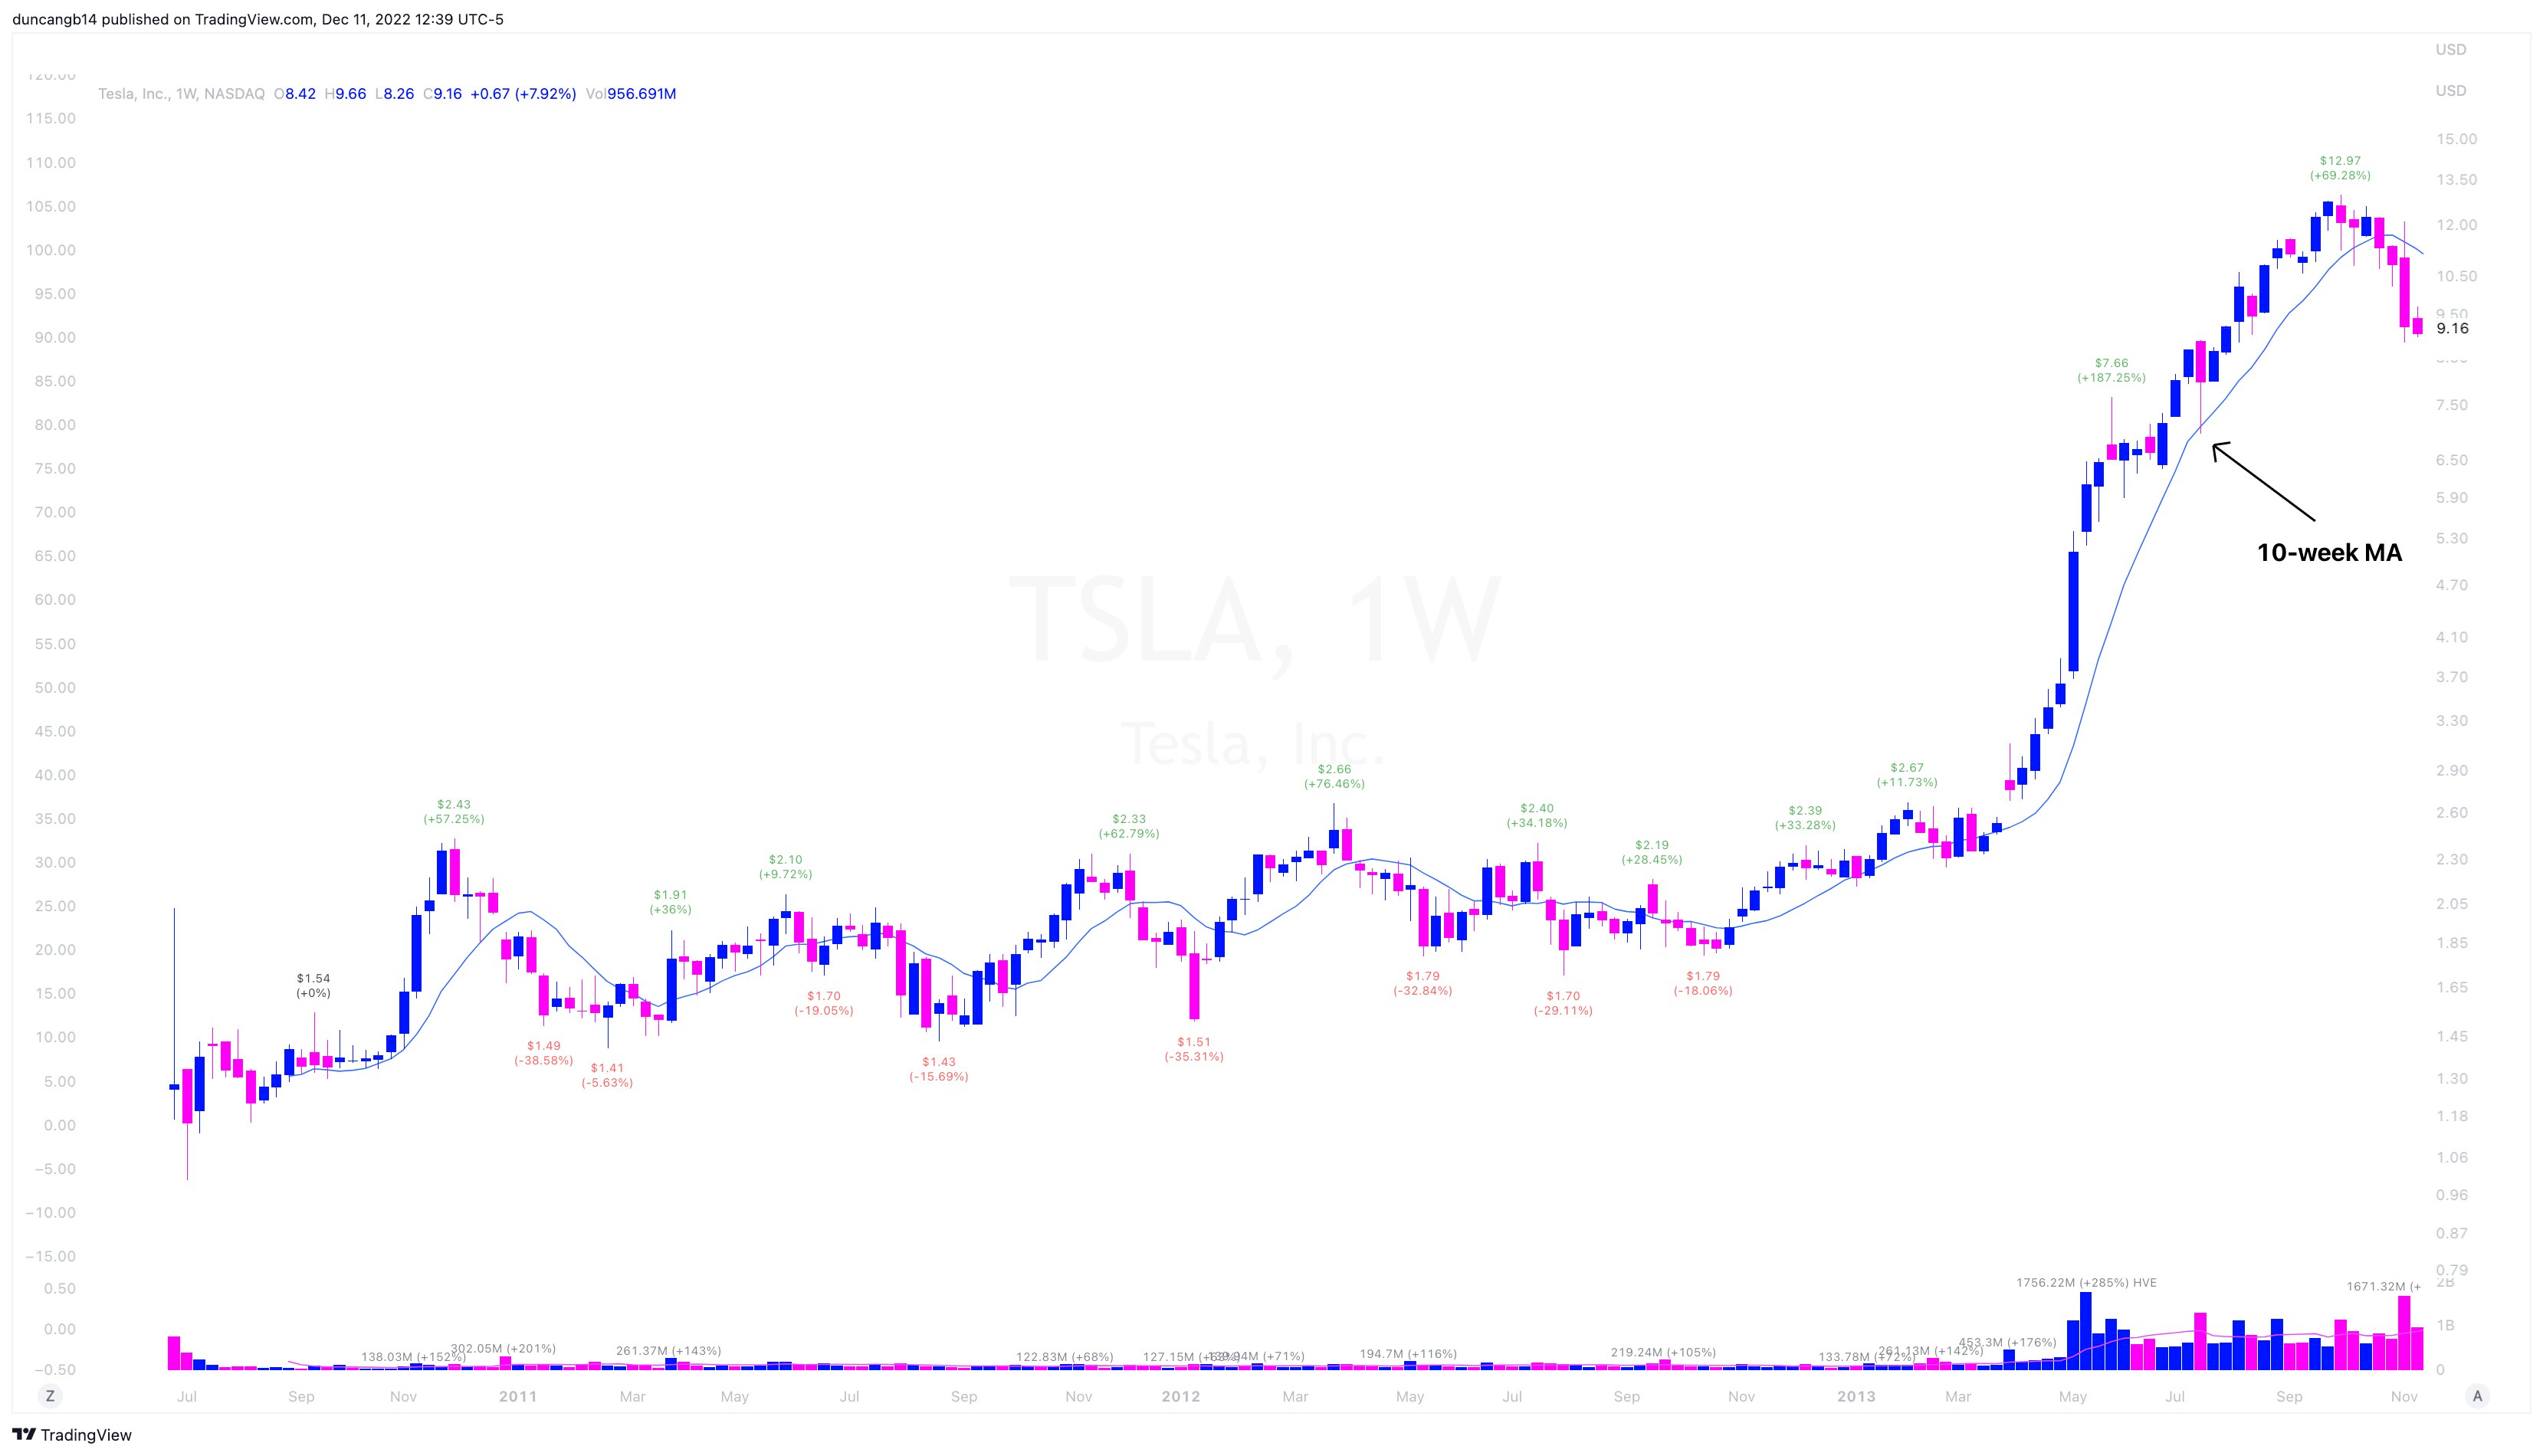
· Stock is at ATH
· 10-week MA uptrending
· Price bounces perfectly off 10-week
Example 2: $TSLA again
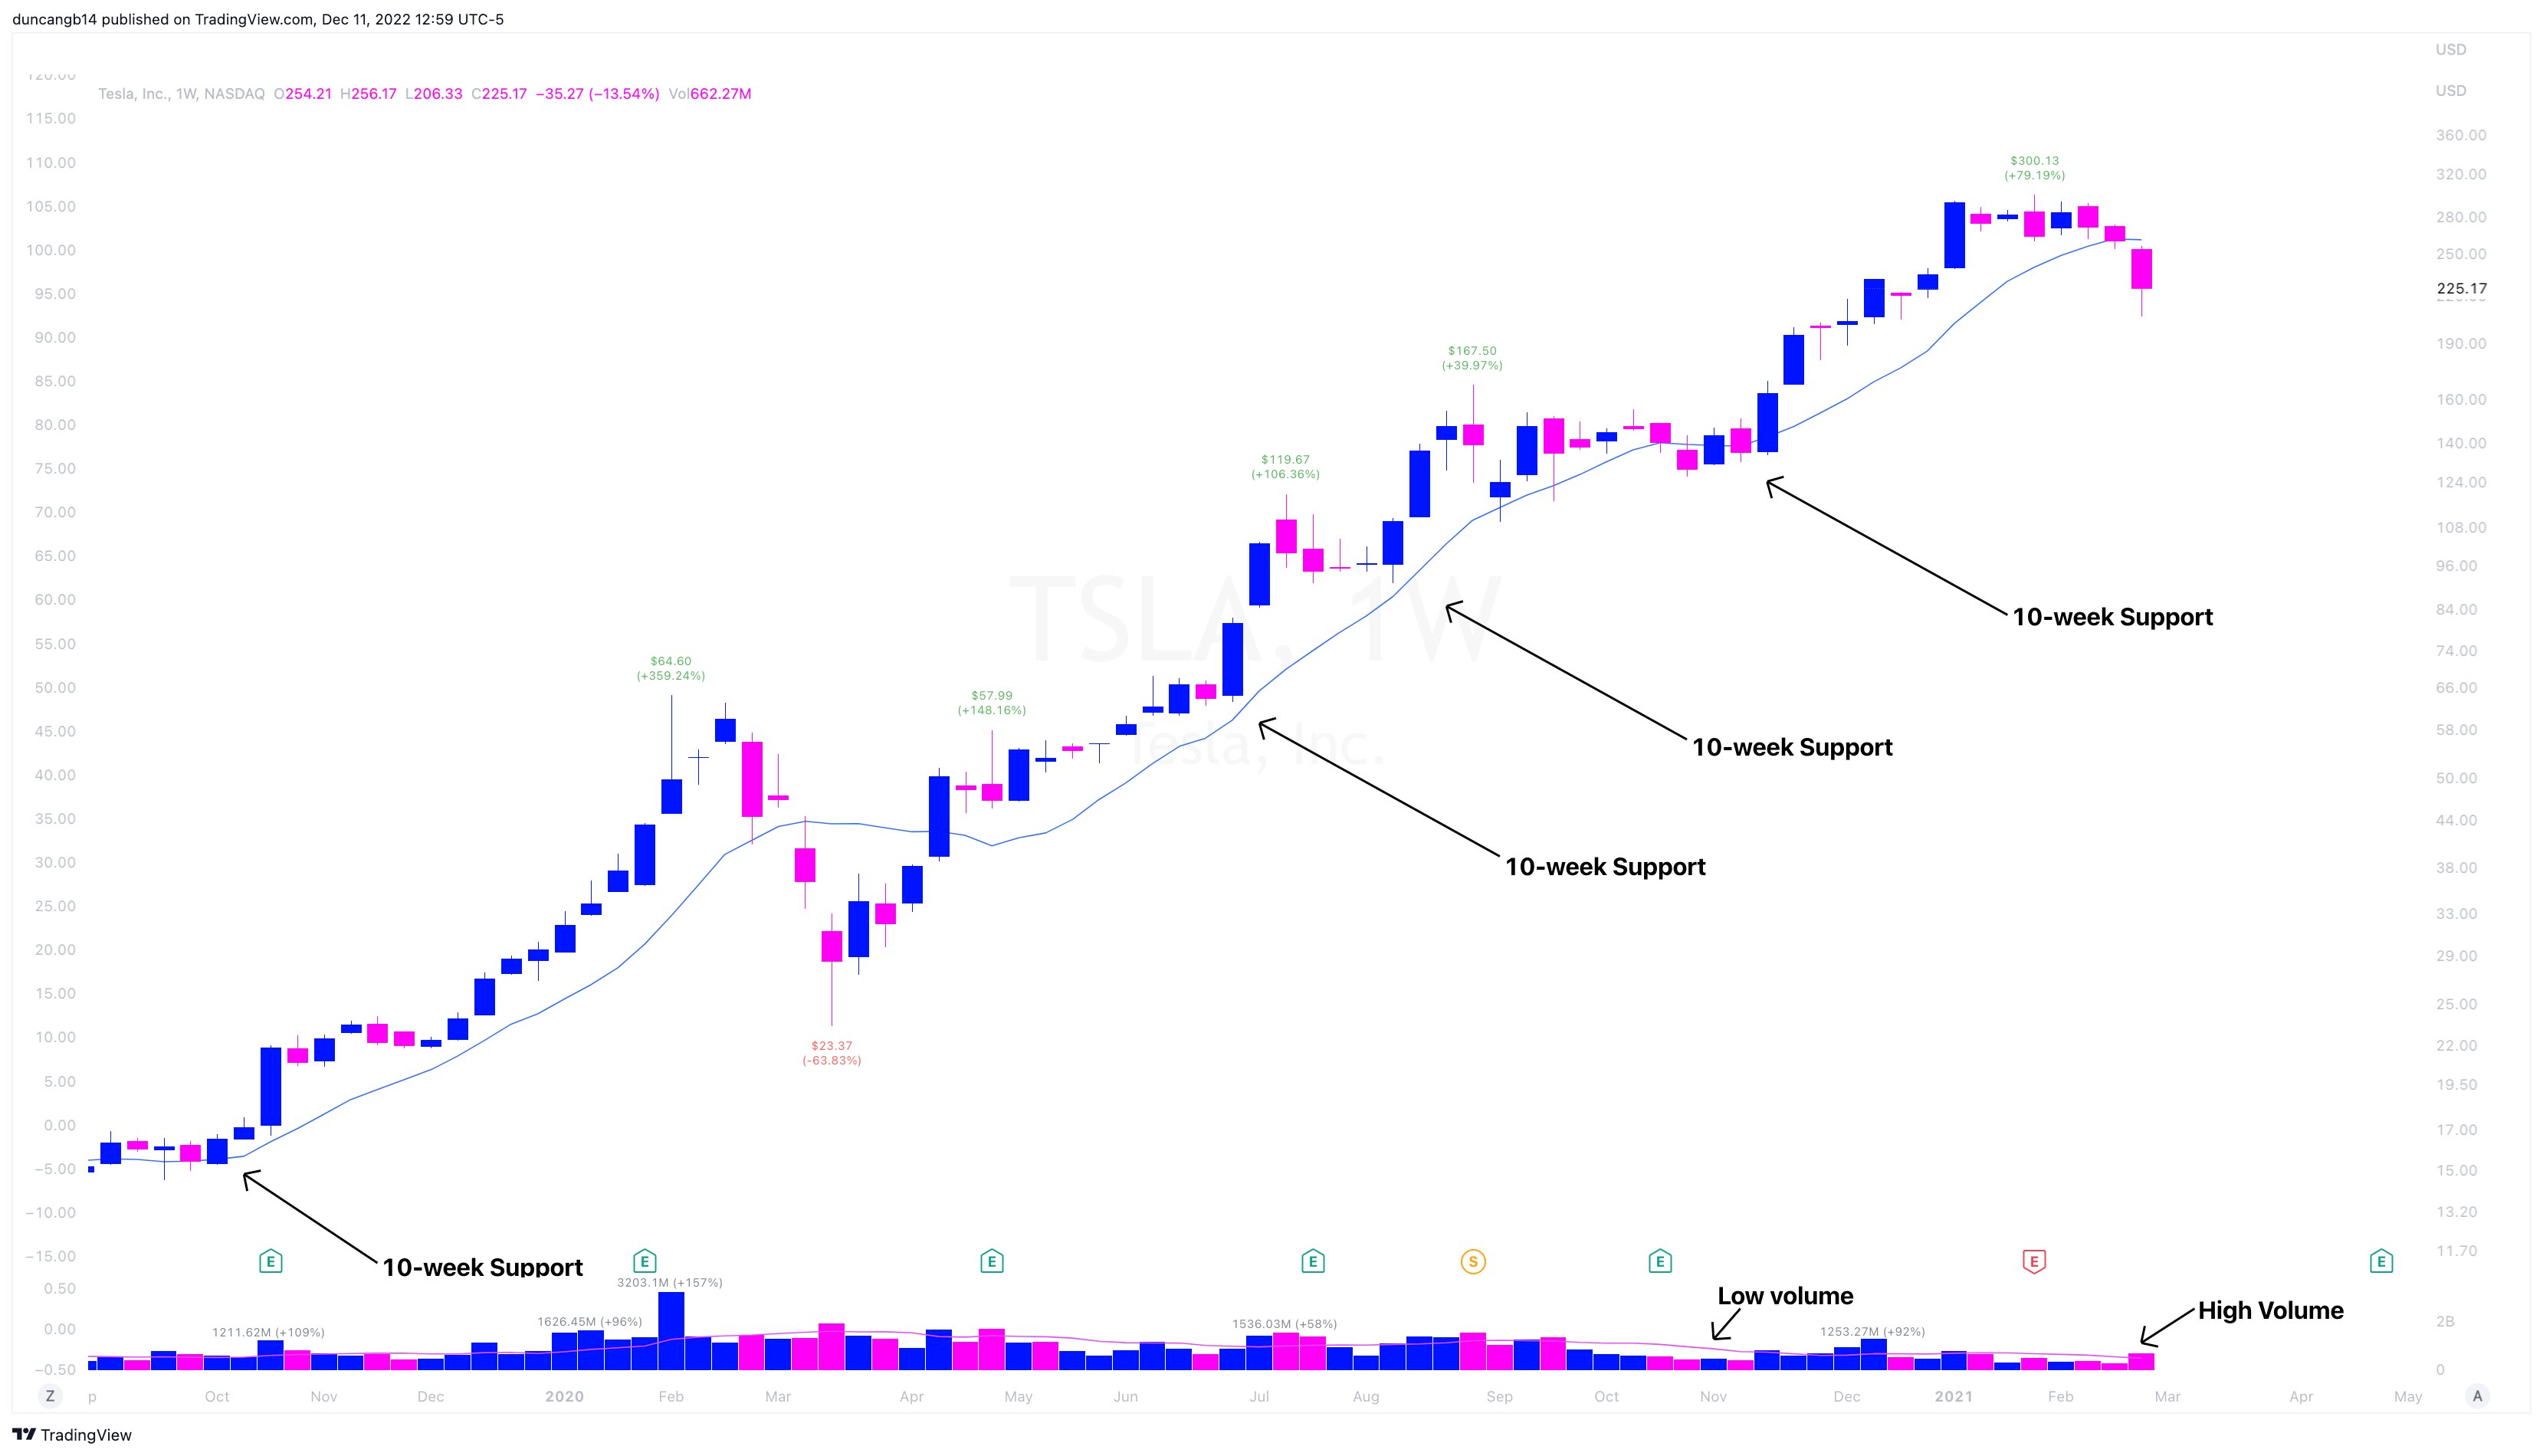
· Stock is at ATH
· 10-week MA is uptrending
· Support and then reverse higher
Example 3: $DXCM
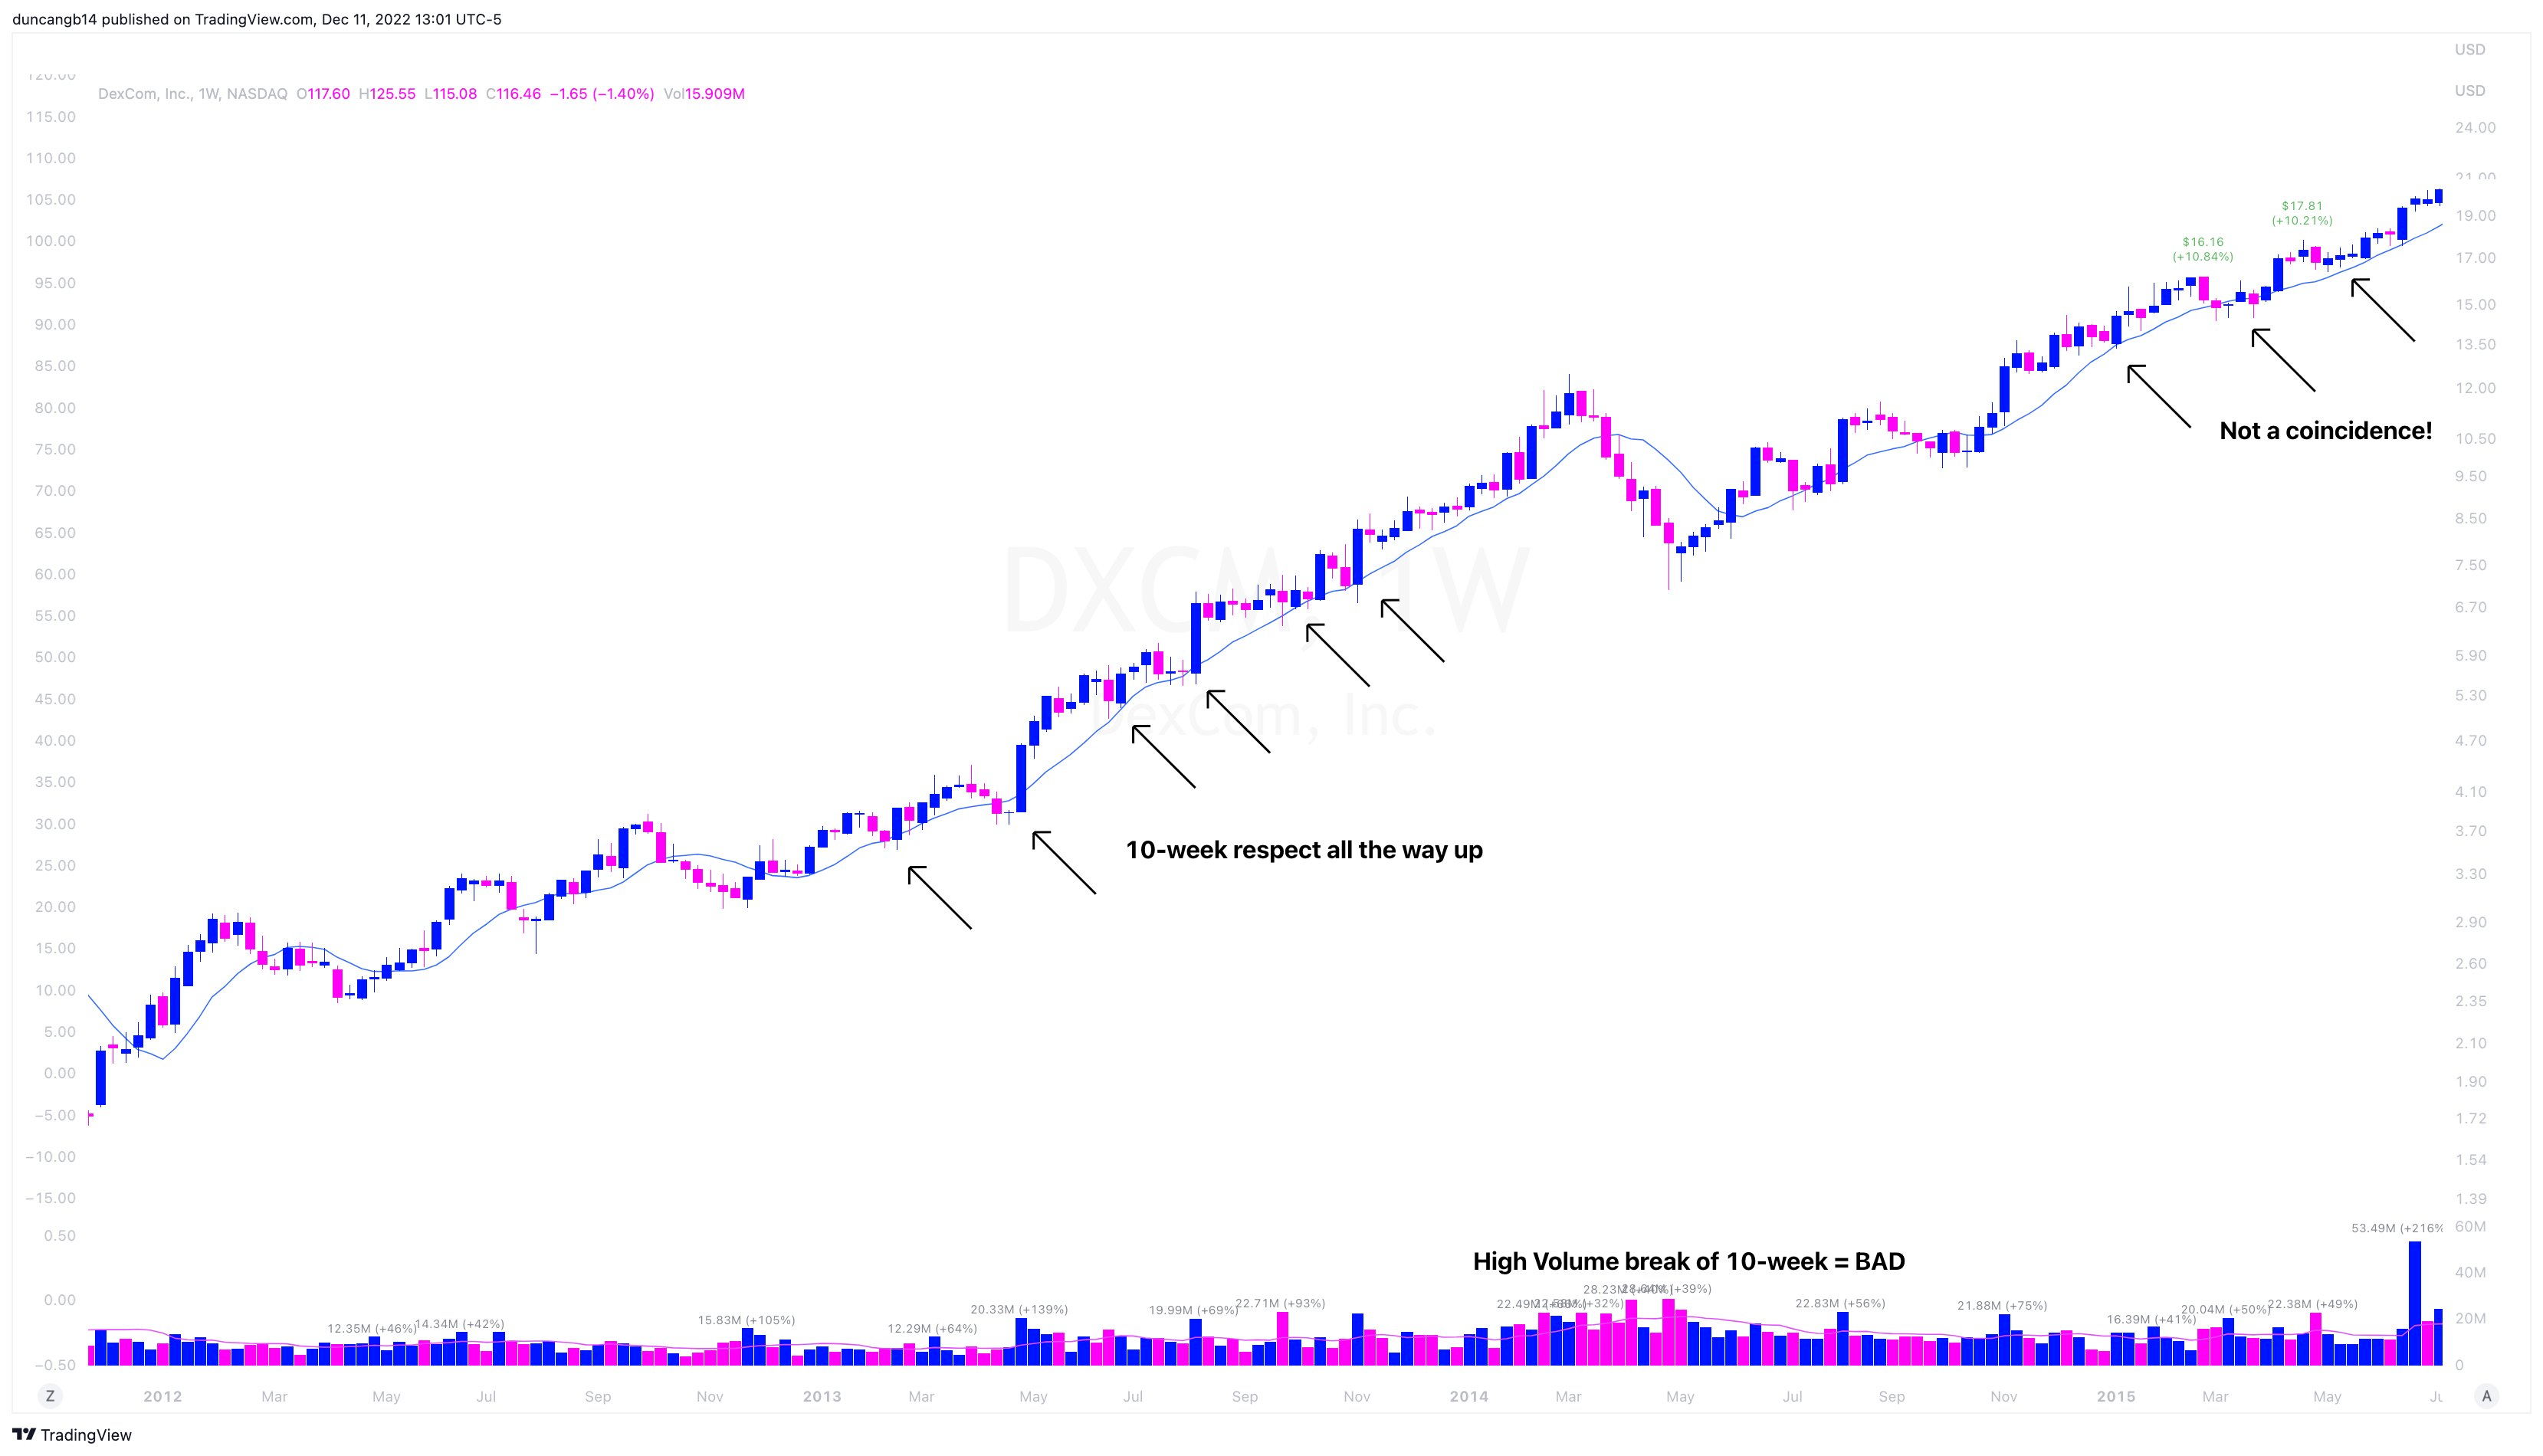
· Stock is at ATH
· 10-week MA is uptrending
· Support and then reverse higher
You can see that when the stock breaks the 10-week MA on volume, it is in for a consolidation or basing period.
Example 4: $EBAY
I didn't mark the chart up so you can spot each 10-week support area for yourself.
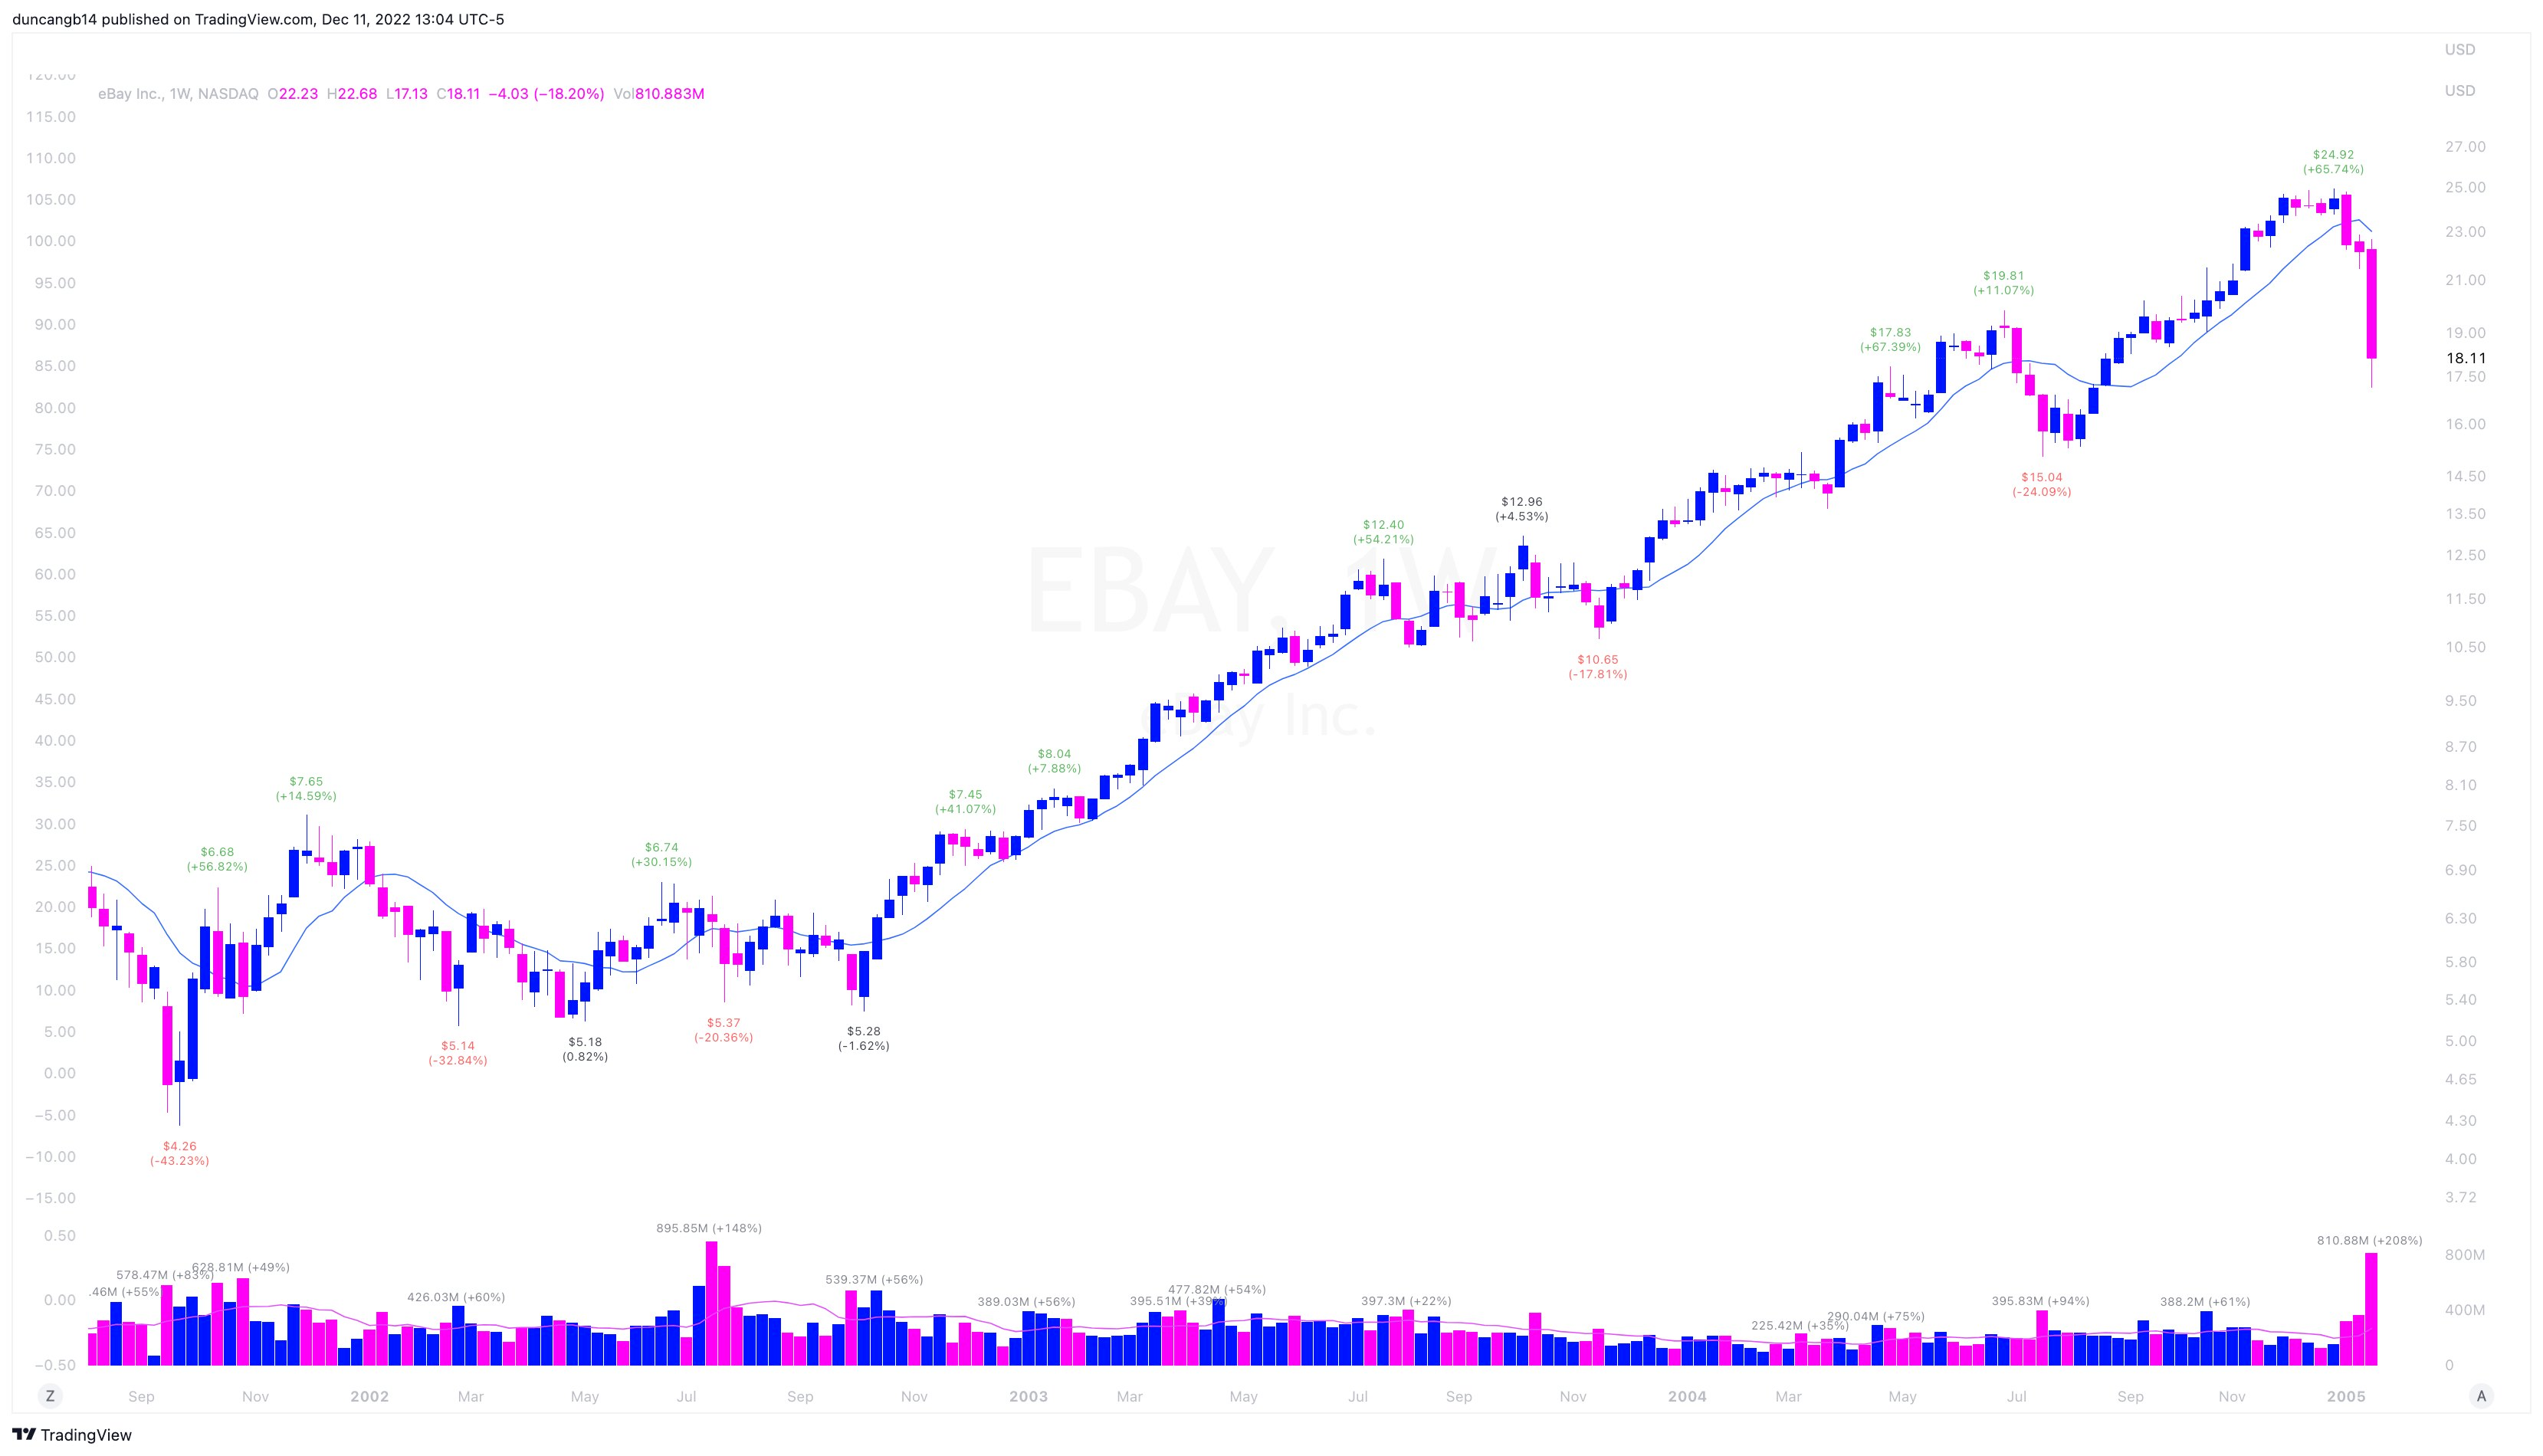
Key takeaways:
· Stock is at 52-week Highs
· 10-week MA is uptrending
· Support and then reverse higher
These patterns repeat over and over again.
Conclusion
To sum everything up, here are the 3 buying strategies you need to add to your trading arsenal:
- High Volume Close (HVC)
- Inside Day & Up
- Moving Average Pullback
With these, you'll be equipped to take on any market.
.jpg)